


Aviation industry data-driven insights

Non-traditional markets lead in the Americas region
26 April 2024
In the Americas, most markets have recovered or surpassed the 2019 levels in terms of both the number of passengers carried and the available seat capacity in 2023.
Net-zero transition: multiple levers in different combinations
19 April 2024
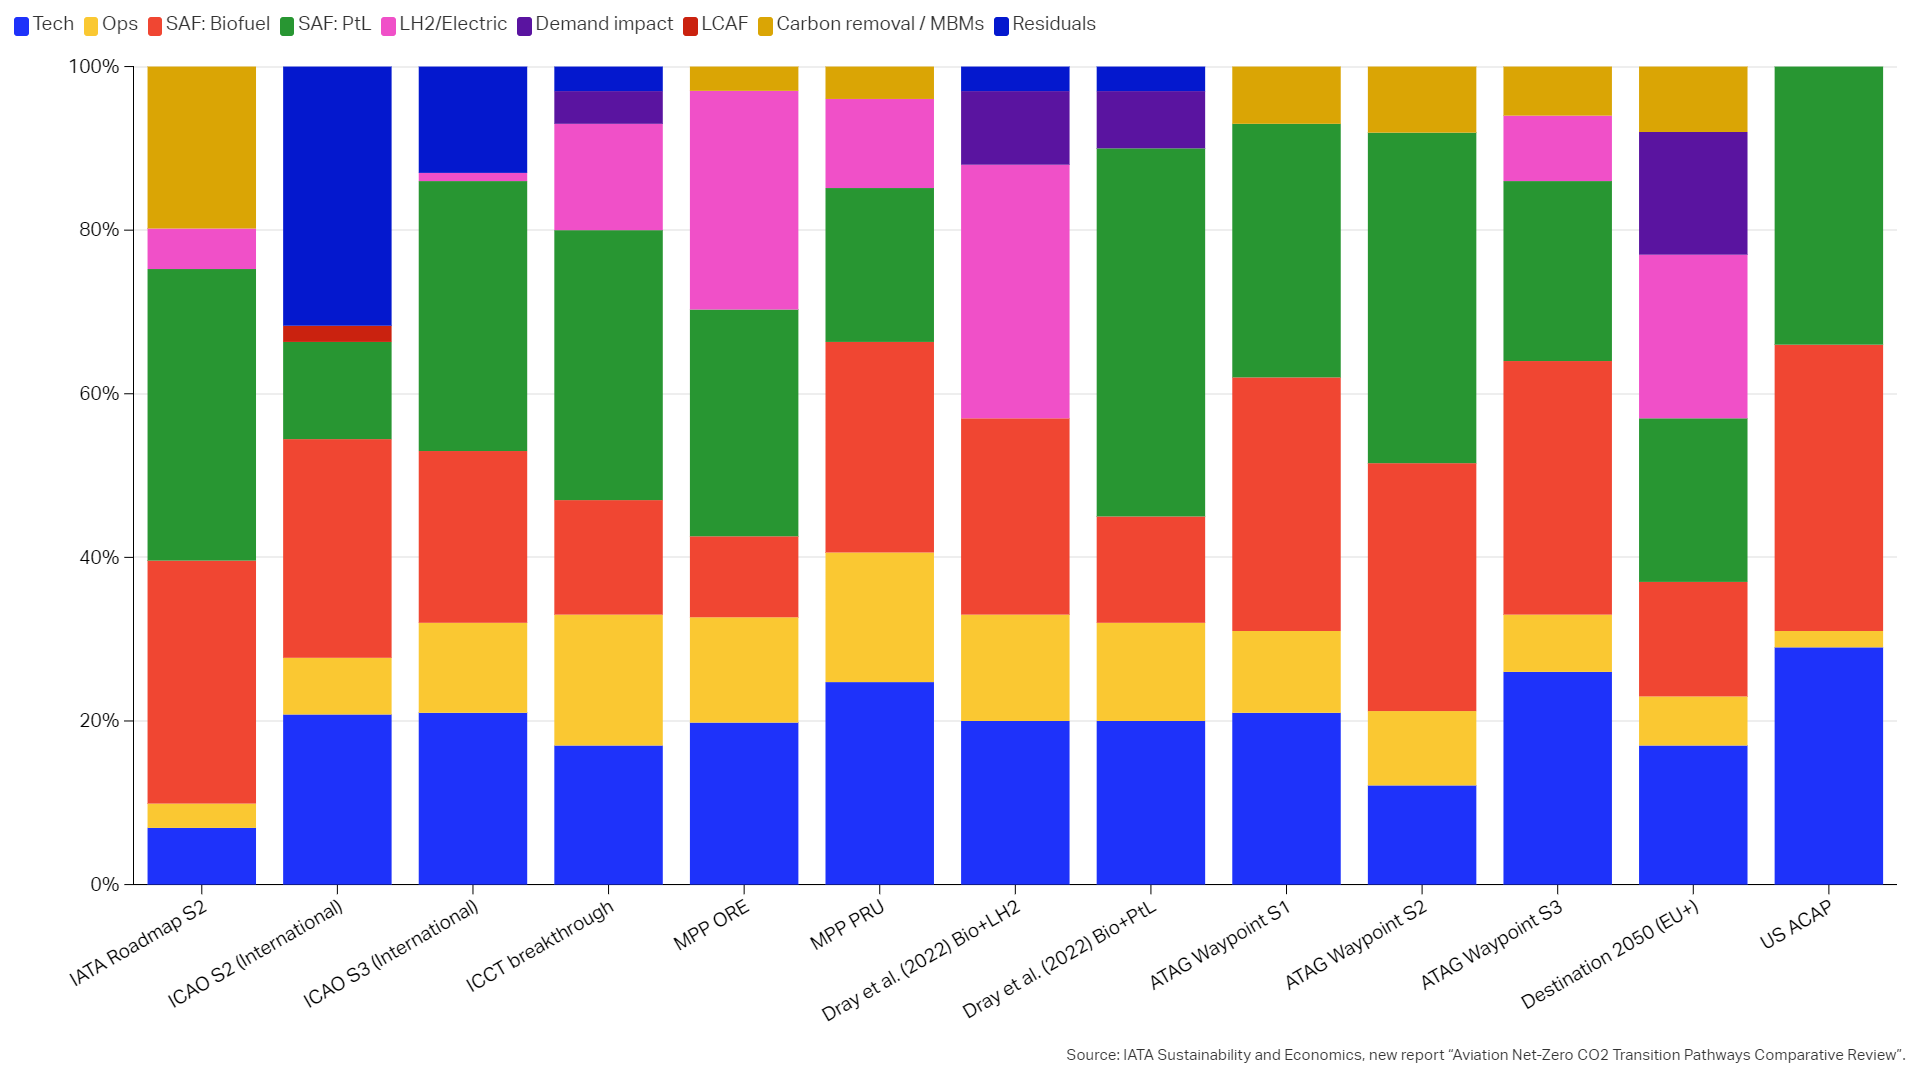
IATA and partners published the first comprehensive review that compares 14 leading net zero CO2 transition roadmaps for aviation.
More aircraft are leased than owned by airlines globally
12 April 2024
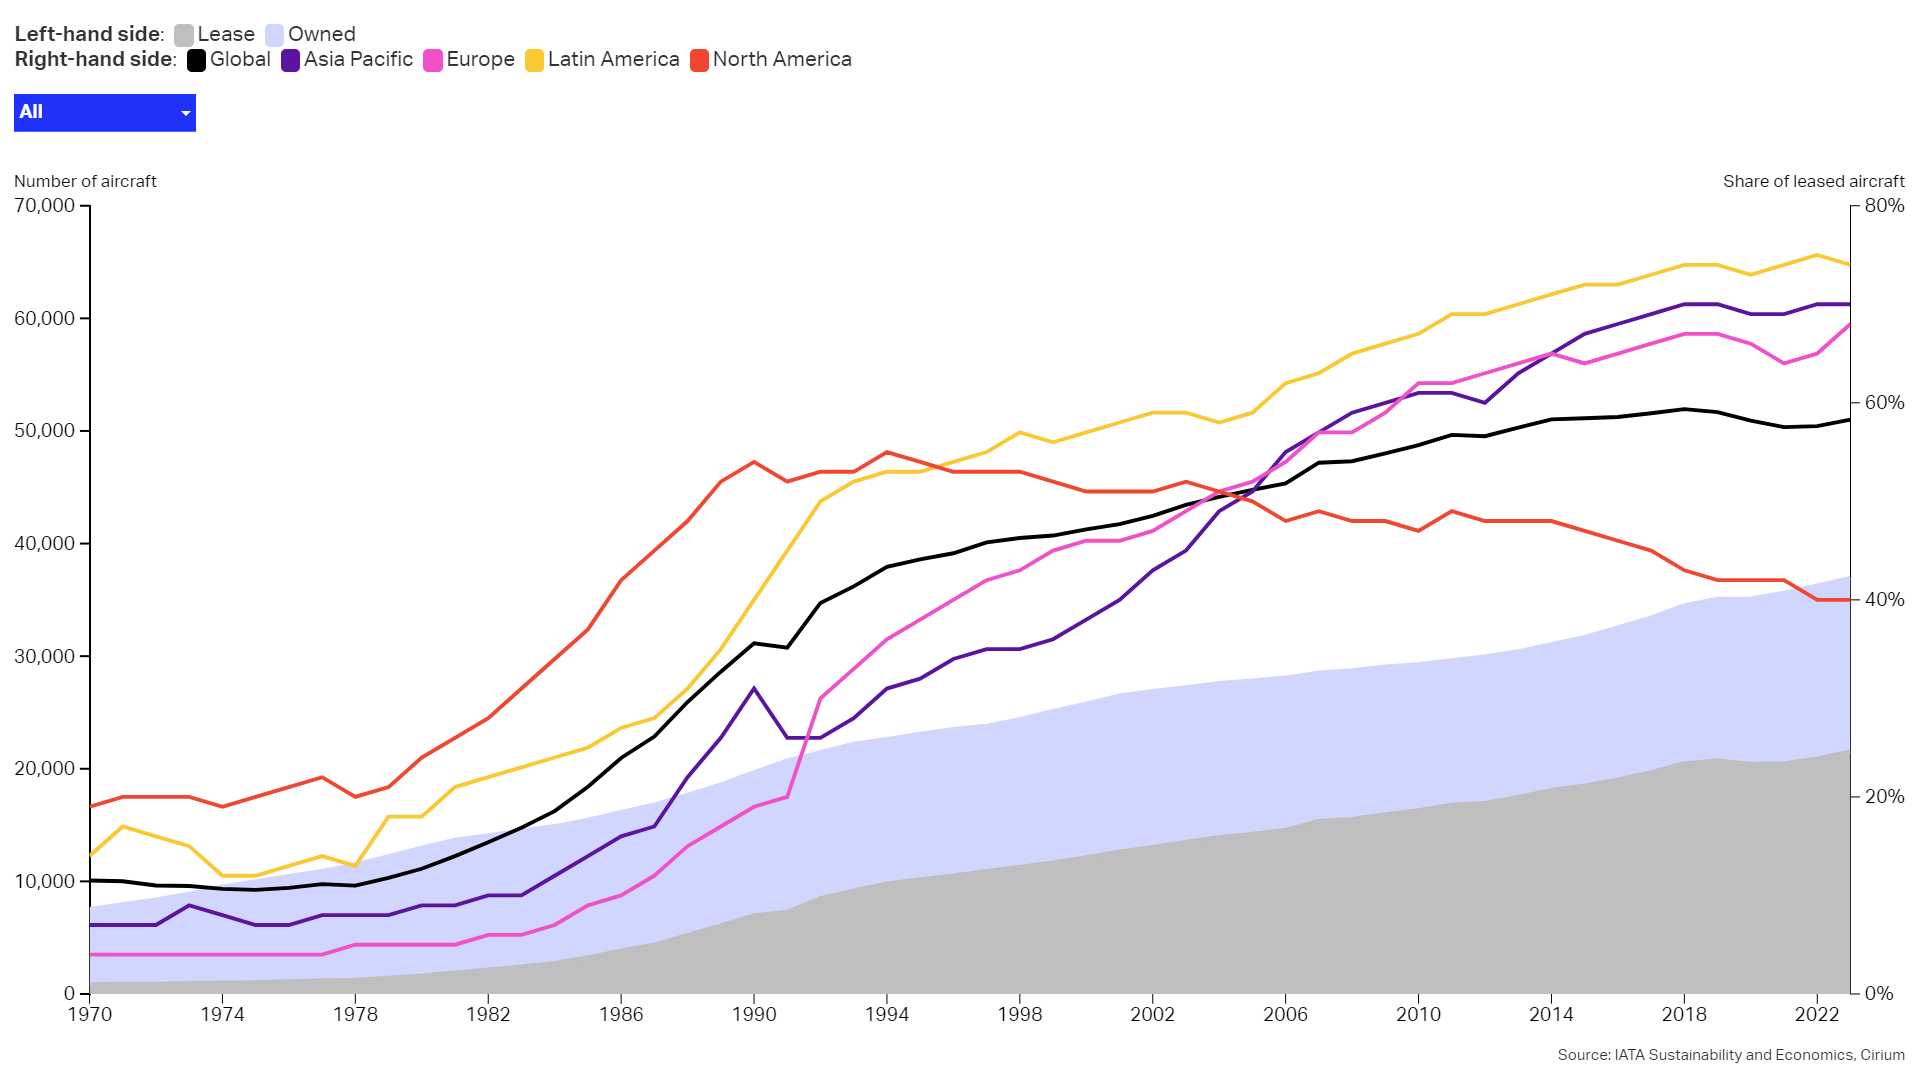
Airlines have a choice between buying their aircraft or leasing them. Leasing has emerged as the preferred option, rising from roughly 10% of the total fleet in the 1970s to 58% at the end of 2023.
Mixed outcomes, positive outlook for Middle East & Africa
5 April 2024
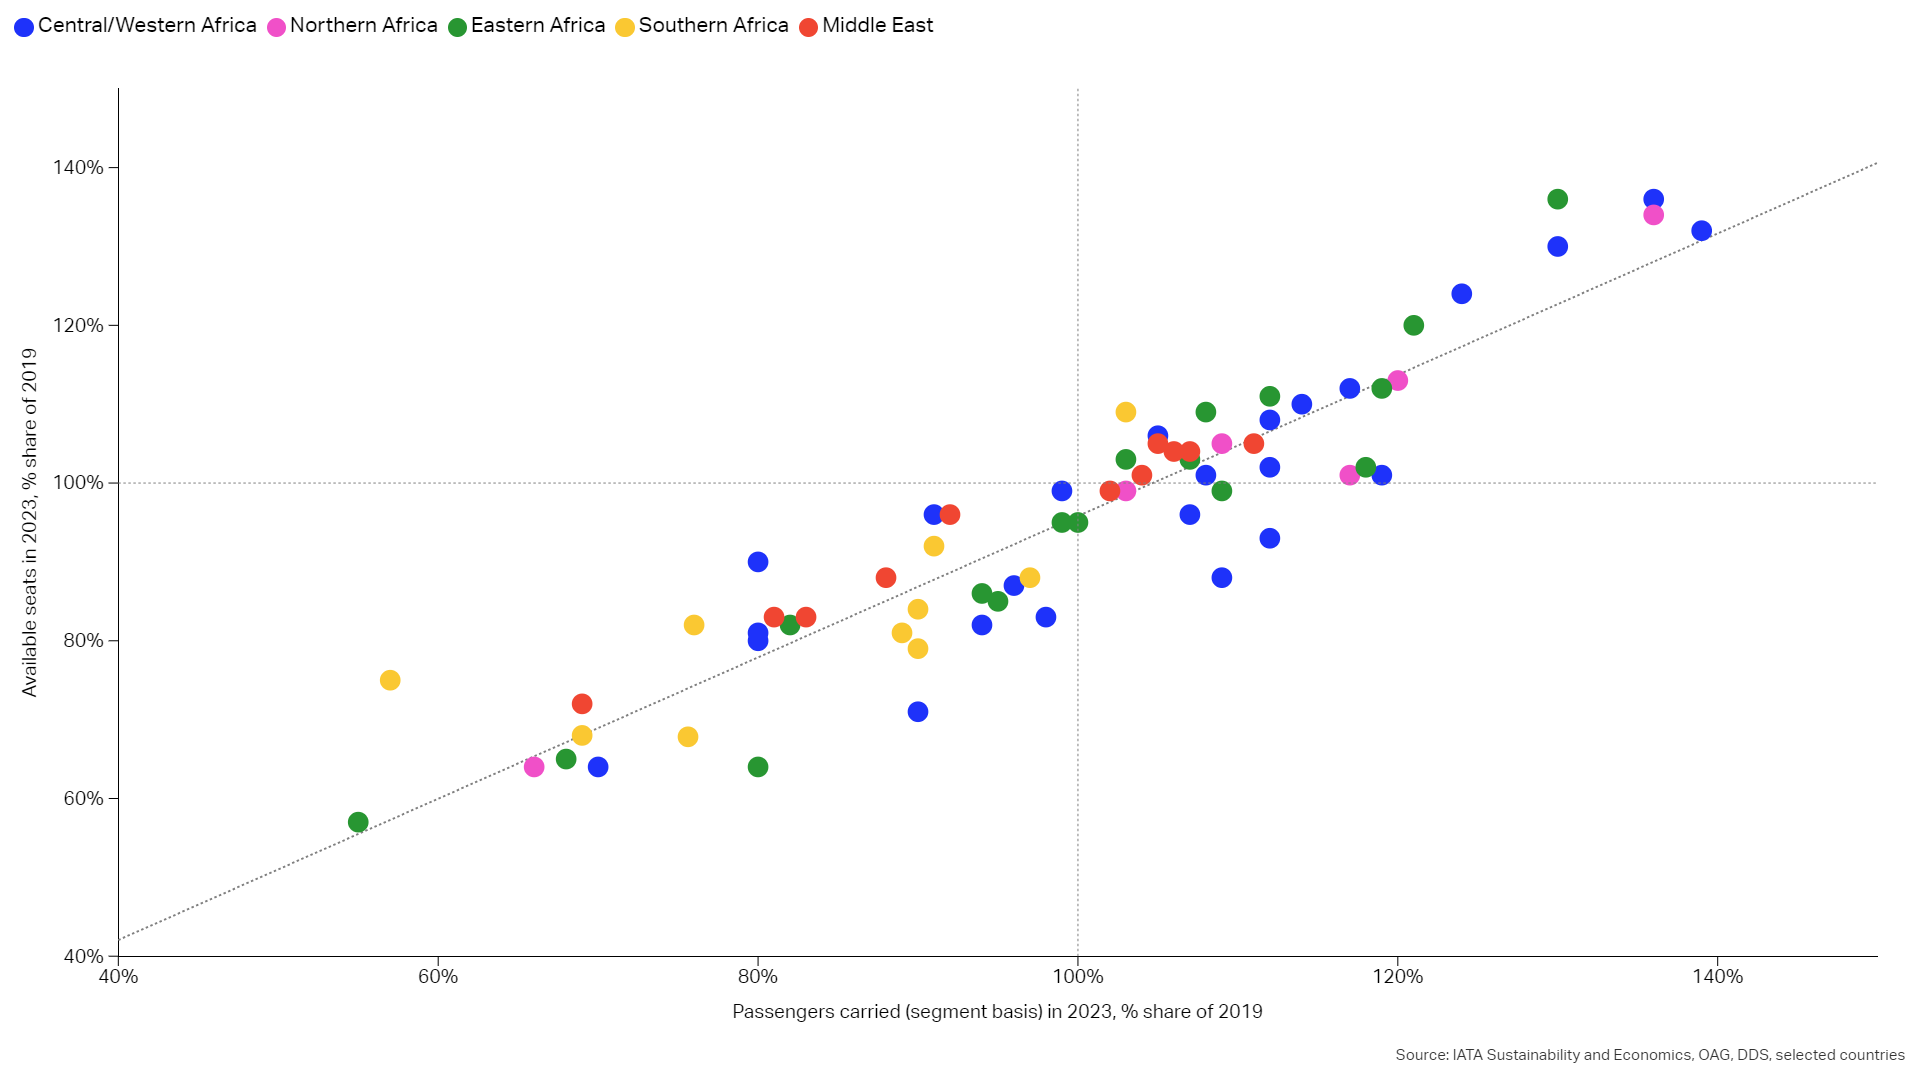
Load factors in the Middle East and Africa region improved significantly in 2023, as the number of origin-destination passengers reached 105% of 2019 levels, while the number of available seats reached 101%.
Weather-related operational disruptions are rising
29 March 2024
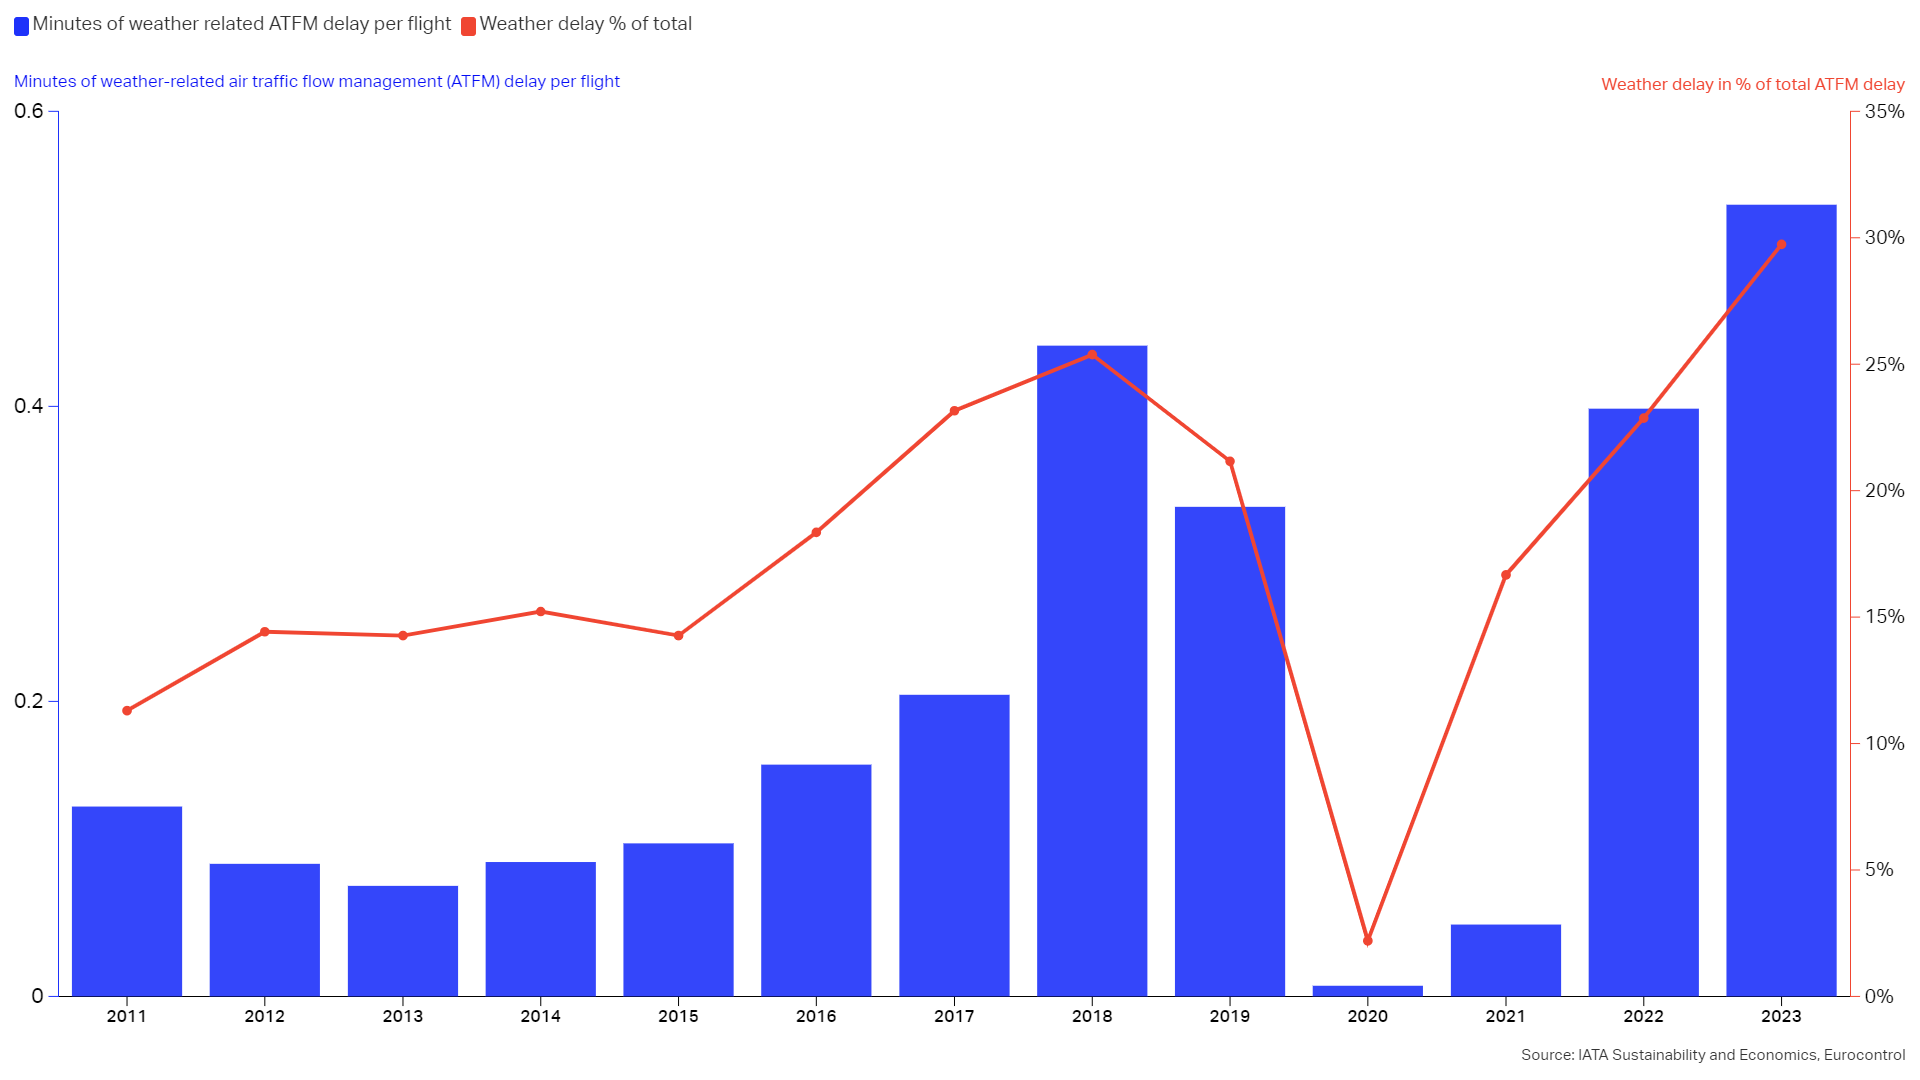
Impact of weather events on flight delays in Europe: Minutes of weather-related air traffic flow management (ATFM) delay per flight & weather delay in % of total ATFM delay.
Eastern and Central Europe take the lead in 2023
22 March 2024
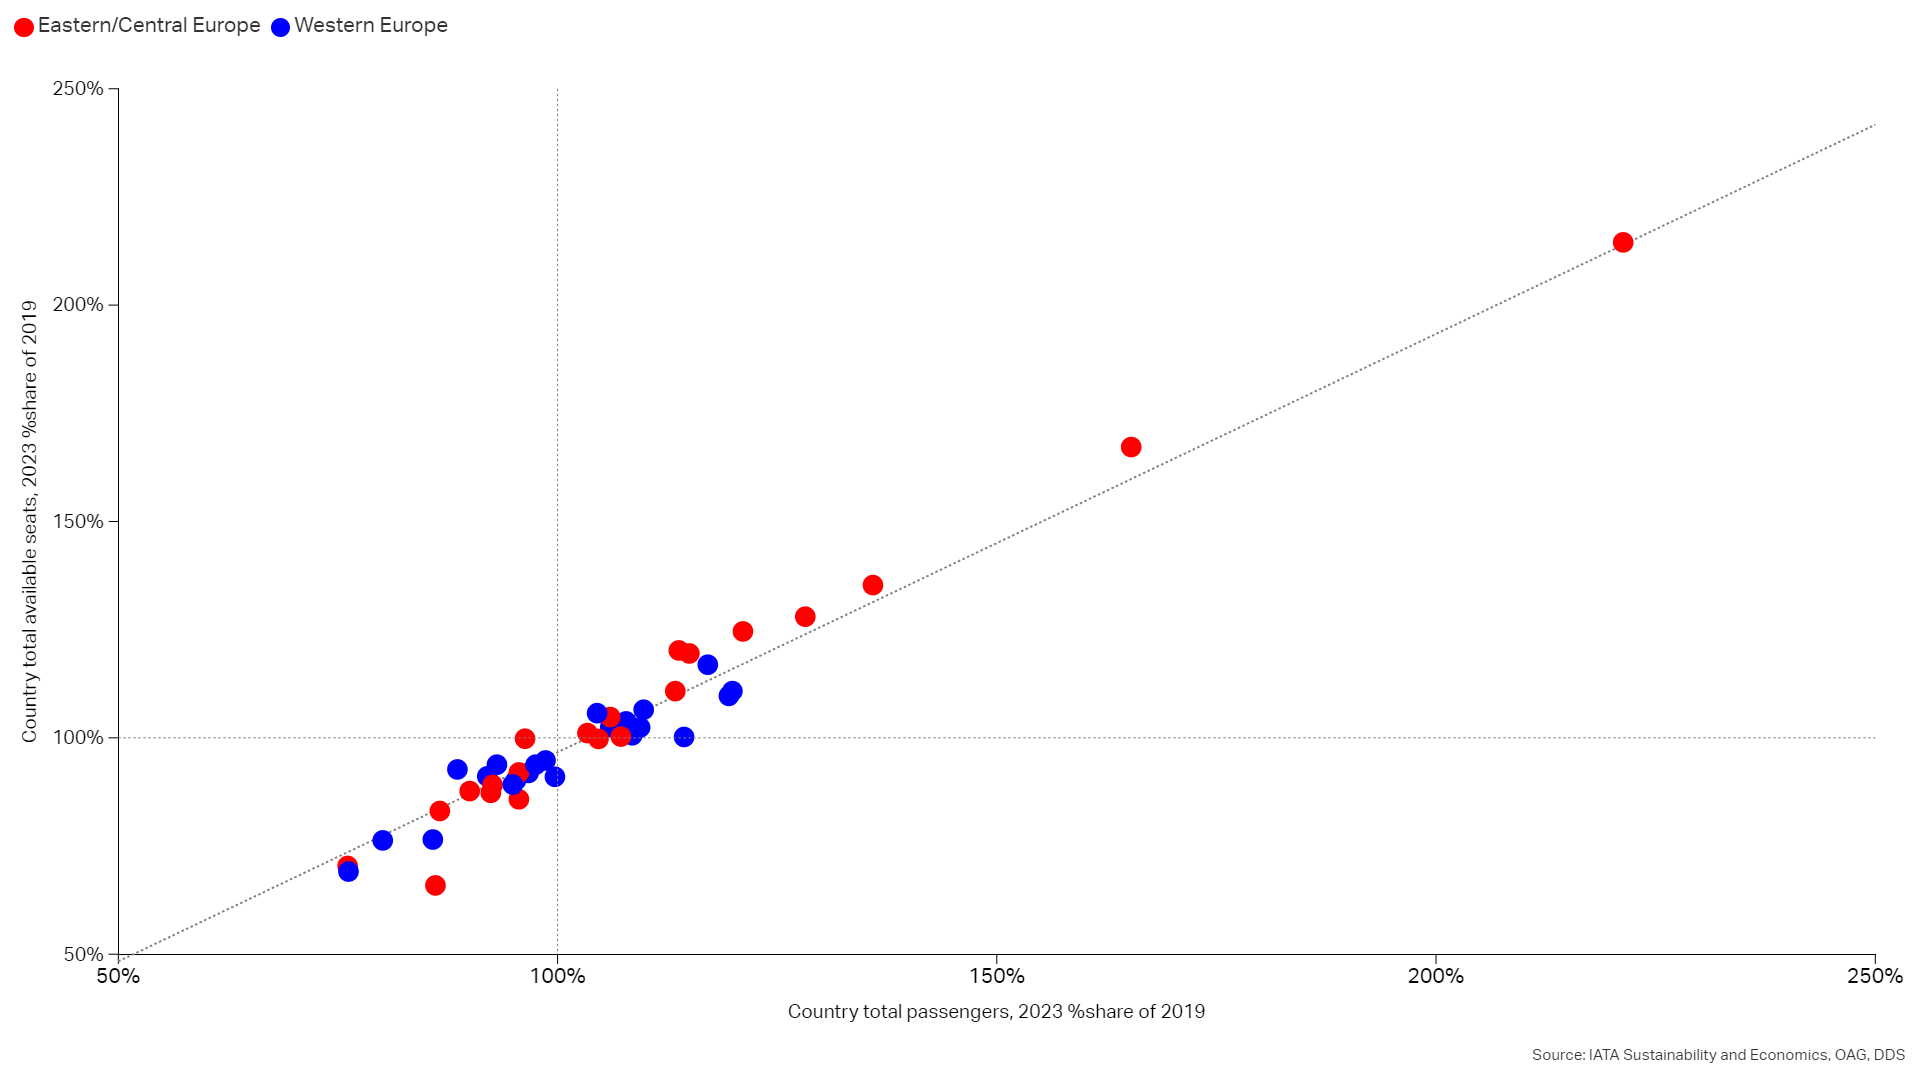
In 2023, Europe as a region regained almost fully the 2019 number of origin-destination passengers. These positive results mask the large spectrum of outcomes among subregions and countries.
The older cargo fleet hampers emissions reductions
15 March 2024
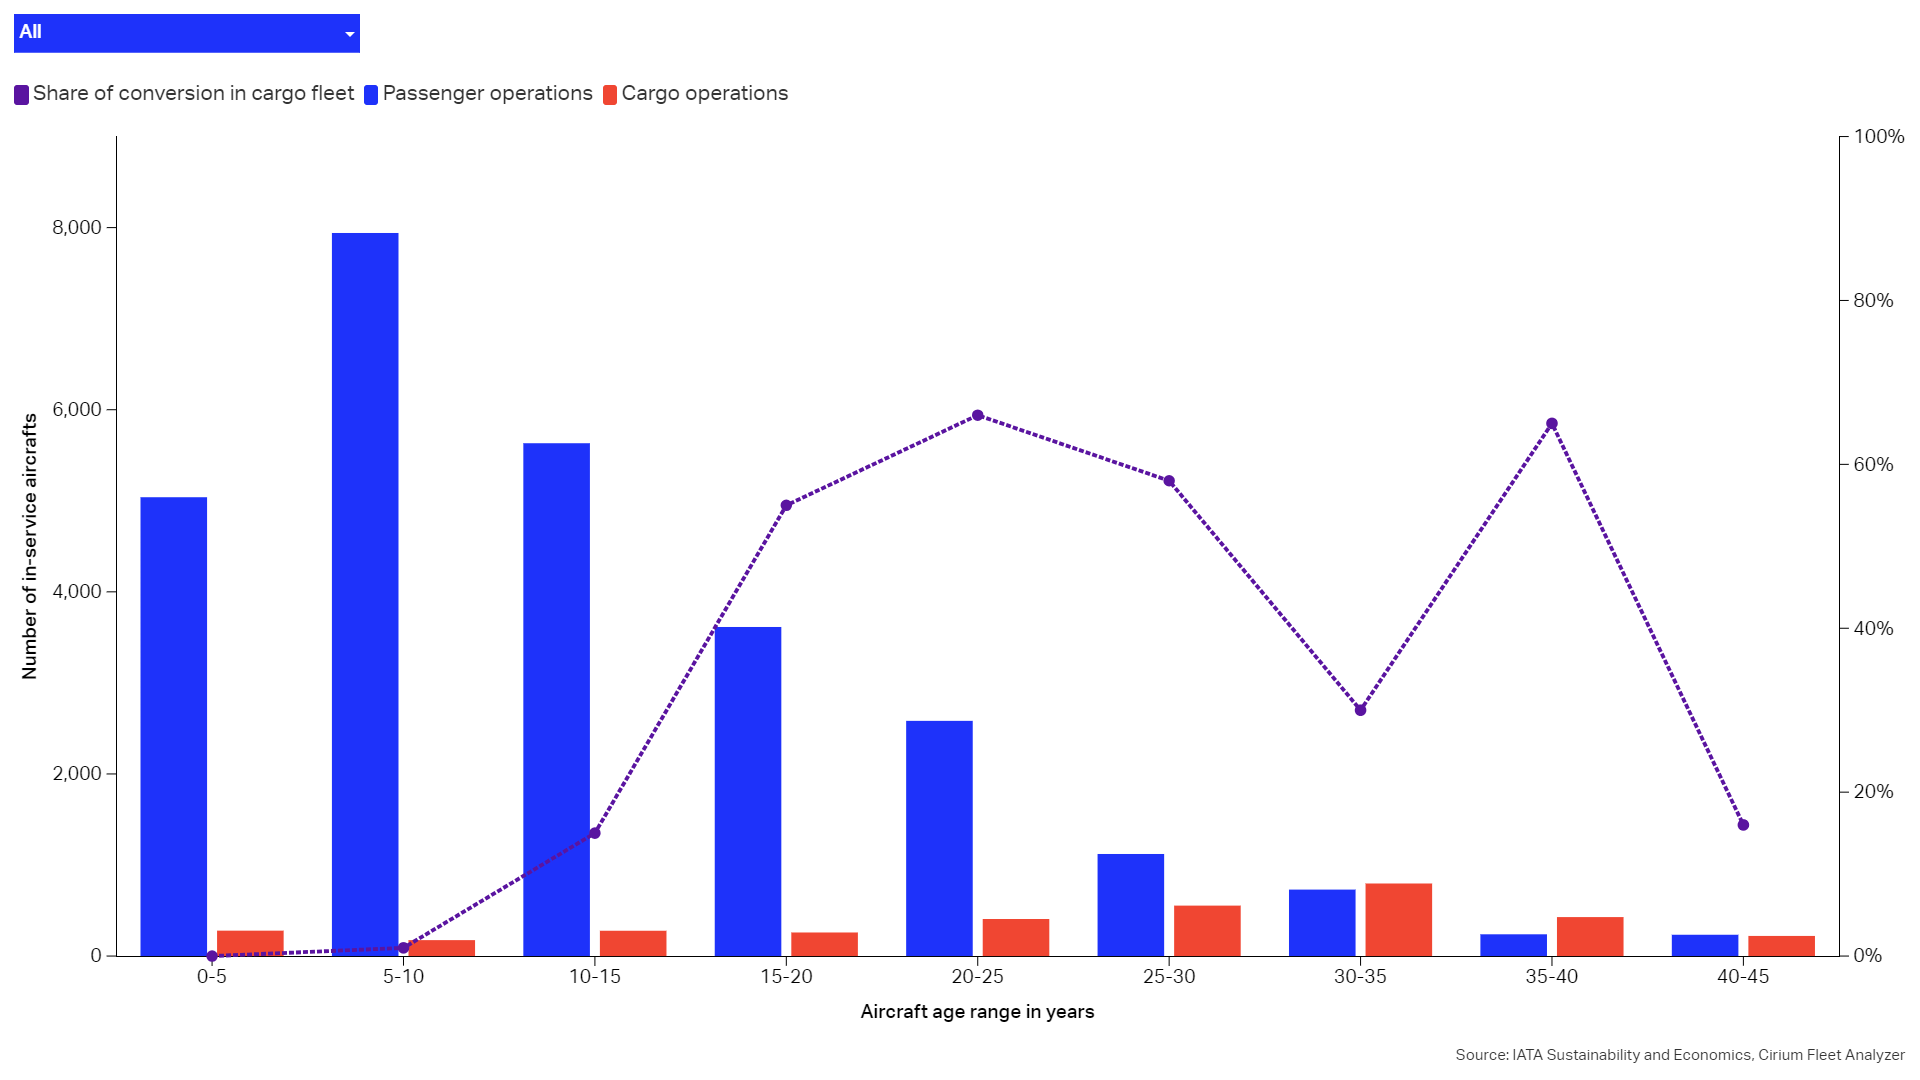
Aircraft in service in passenger operations are, on average, 13 years old. The average age of aircraft flying cargo is significantly higher, at 25 years.
Gender diversity in aviation improving – but more to be done
8 March 2024
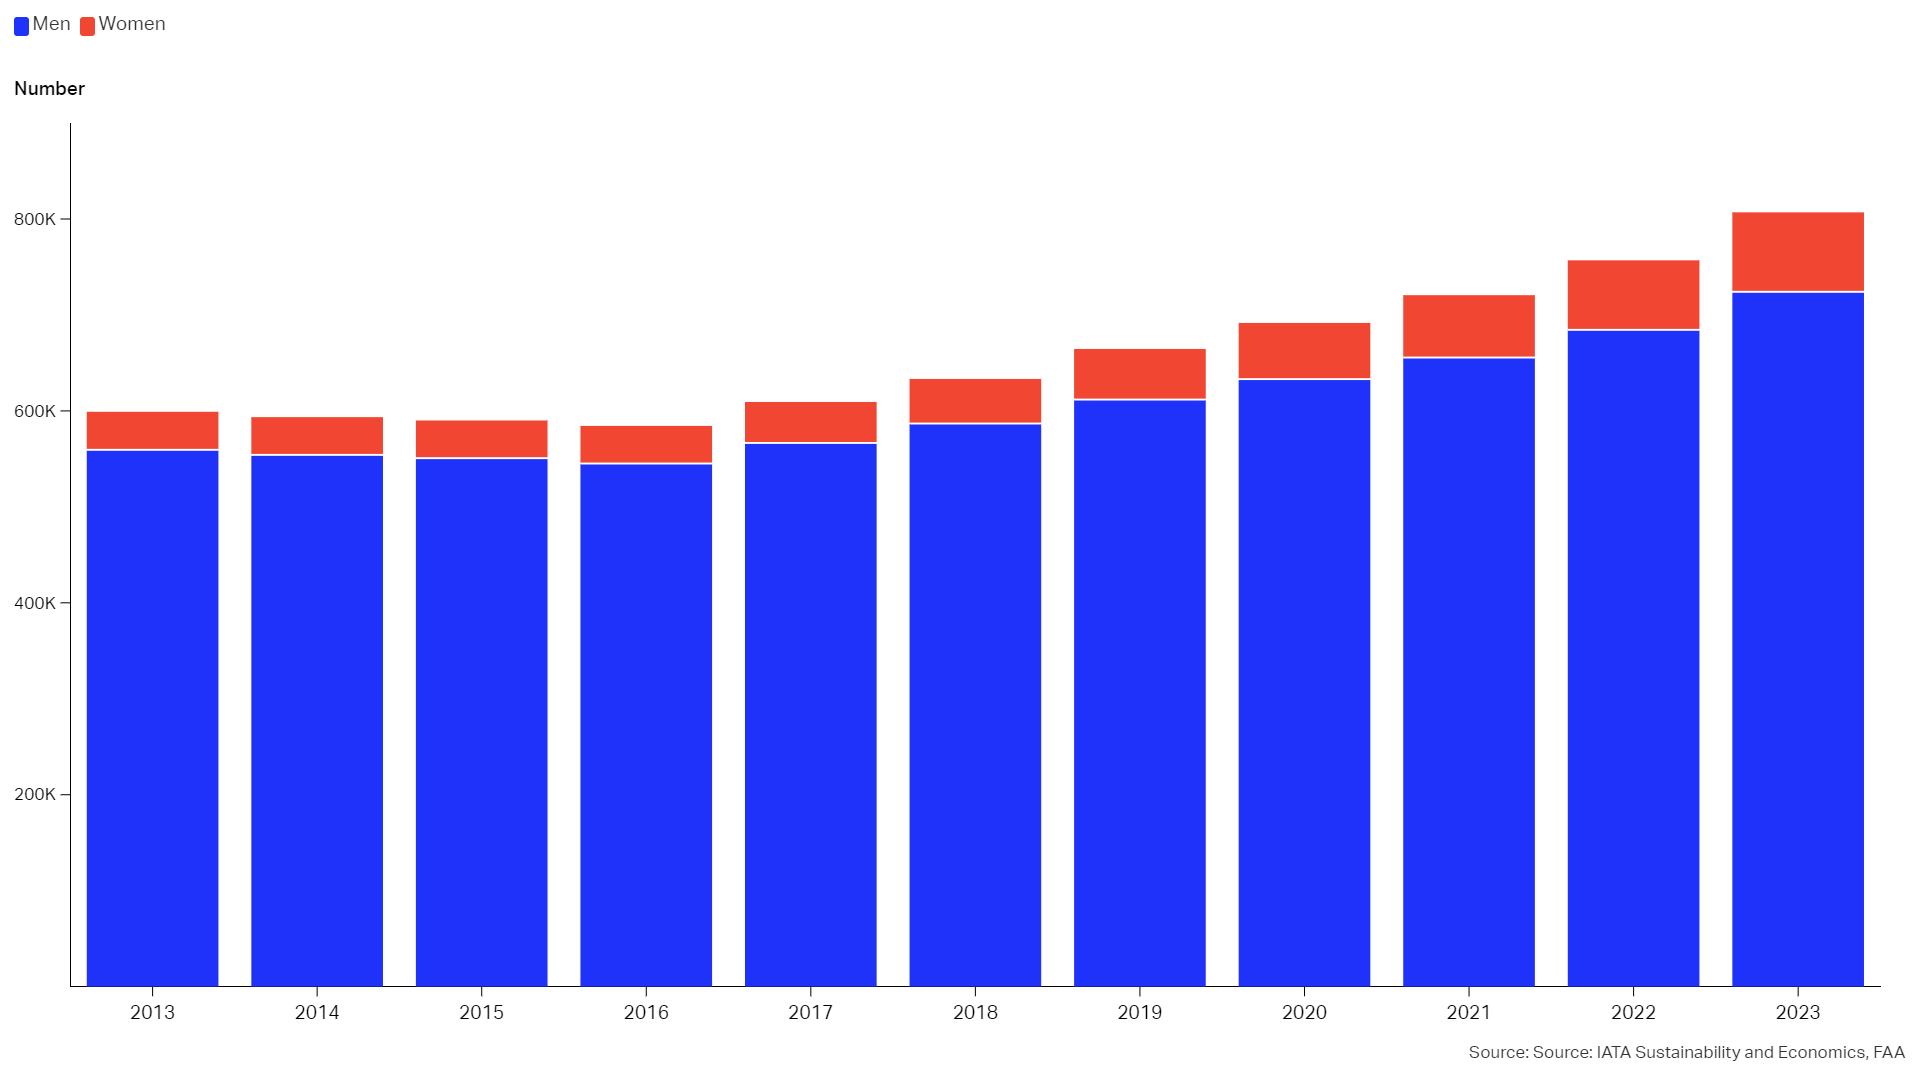
The industry’s commitment to improving the gender balance is starting to deliver results.
Greenhouse gases in review
1 March 2024
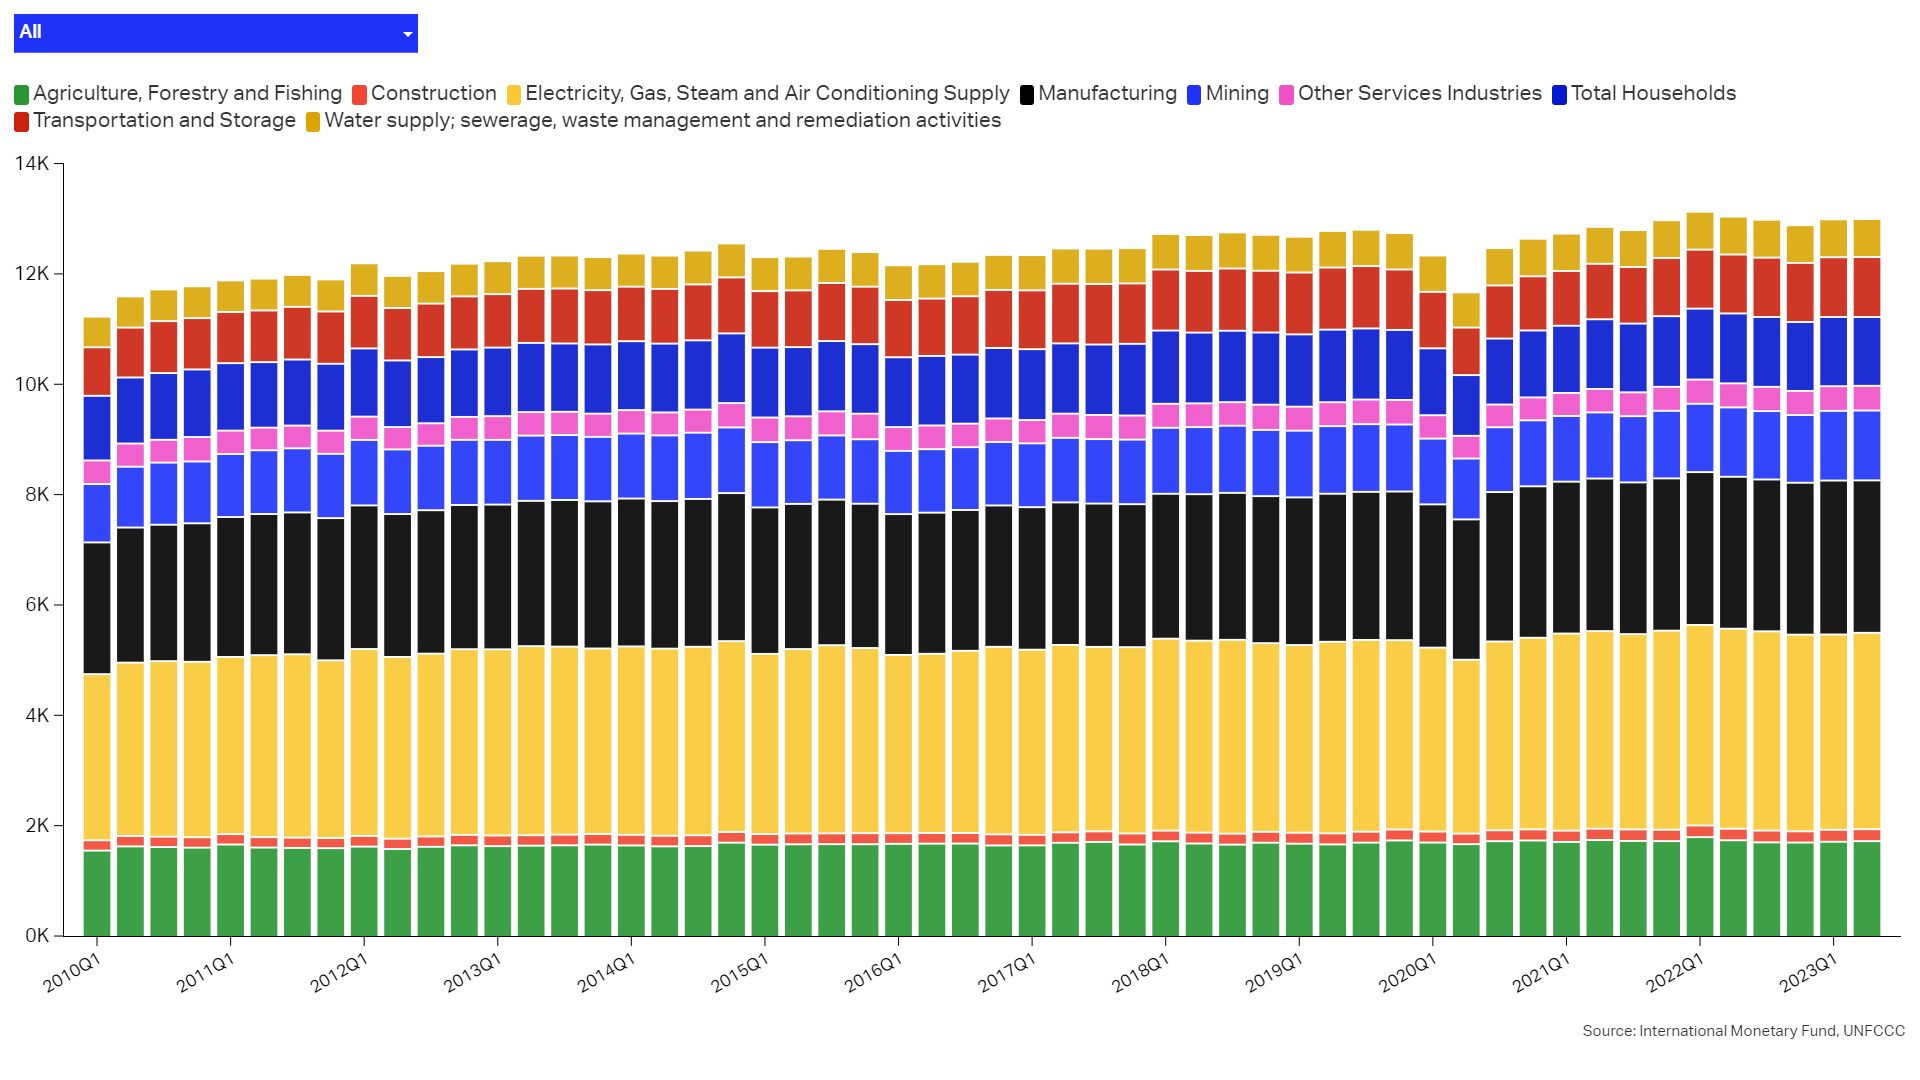
Greenhouse gases (GHG) include not only carbon dioxide (CO2) but also methane (CH4), nitrous oxides (NOx), and others. How much various parts of the global economy generate of all the greenhouse gases can be seen in the chart.