


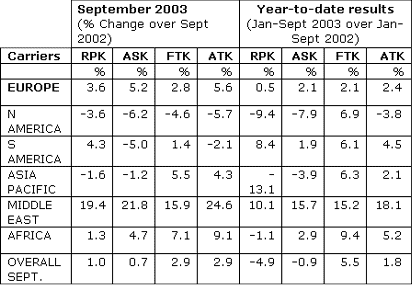
Overall RPKs for September 2003 show a 1% improvement over results for same month of the previous year. Although small, this is a significant increment, as it confirms the steady traffic rise of the past three months. Robust growth in Europe (3.6%) and high growth in the Middle East (19.4%) contributed to this worldwide result. Although still reporting negative passenger figures in Asia-Pacific (-1.6%) and North America (-3.6%), both regions have shown good improvement over the previous month's results (respectively -4.6% and -6.5%). On the freight side, both FTKs and ATKs are recorded at 2.9% better than September 2002.
A comparison of industry growth today with the period prior to the effects of 9/11, Iraq and SARS provides another view of industry recovery. Passenger traffic growth for Aug 2003 over Aug 2001 is down 4.2% on the 2001 results, whereas freight is a strong +14% above 2001 level.
;Overall capacity was up by 0.7%, contributing to a drop in September passenger load factor to 75.5%, down from 79.5% in August 2003, but almost identical to September 2002 (75.6%).Preliminary cumulative international passenger results for the first nine months of 2003 are 4.9% below the same period for 2002. These results confirm the slow but steady recovery rate, climbing from the lowest point registered in Jan-May (-7.7% compared to Jan-May 2002). IATA continues to forecast that overall international passenger traffic levels in 2003 will be approximately 1% lower than 2002 by year end if stable conditions prevail.
Year on year growth for the overall international freight market continues to slow slightly, at 5.5% as compared to 6% in August and 6.4% in July. The Middle East region continues to be highest freight growth market at 15.2%.
INTERNATIONAL TRAFFIC AND CAPACITY
All figures are provisional and represent total reporting at time of publication plus estimates for missing data.
Notes for Editors
1. Explanation of measurements:
a. RPK: Revenue Passenger Kilometres measures actual passenger traffic
b. ASK: Available Seat Kilometres measures available passenger capacity
c. FTK: Freight Tonne Kilometres measures actual freight traffic
d. ATK: Available Tonne Kilometres measures available total capacity
2. IATA statistics cover international scheduled air traffic; domestic traffic is not included.