(Geneva) "The air transport industry continues its determined climb back to real industry growth. With a 2.5% passenger traffic increase, for the first time this year, passenger growth has surpassed freight growth," announced Giovanni Bisignani, IATA Director General and CEO.
October 2002 / October 2003 Comparison
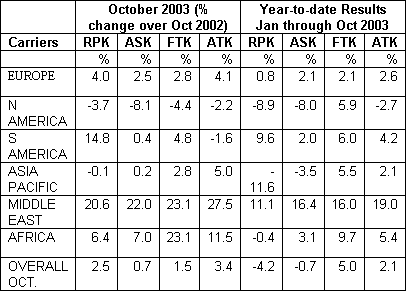
October passenger traffic increased 2.5% and freight traffic was up by 1.5% as compared to October 2002. Europe continues to show robust passenger traffic (PRK) growth, up 4% over October 2002. The Middle East has also maintained a strong pace, recording a 20.6% rise, as have carriers in South America at 14.8% and Africa at 6.36%.
A continuation of recovery has been reported from Asia Pacific as well, coming in at only 0.1% below last year's October results, a significant rebound from all time lows in May due to the SARS impact. Only North America continues to be dogged by lower year-over-year performance comparisons for passenger and freight traffic.
Overall international freight traffic has slowed, although still showing a 1.5% rise compared to results for same month in 2002. Asia Pacific region recorded a 2.8% increase, compared to 5.5% growth reported in the previous month's comparison. Middle East and Africa lead in regional results, each at 23% over 2002.
Year-to-date Cumulative Figures, January through October
Traffic trends continue to point to a steady recovery. The cumulative international passenger results for January through October 2003 are 4.15% below results for January-October 2002, but this is an improvement over January-September cumulative results (-4.9%).
Year-to-date results for freight traffic reflect a slow-down in the international freight market, at 5.0% growth for January through October, as compared to 5.5% growth rate reported January through September.
Capacity
There was a 0.7% improvement in overall capacity (ASK) for October compared to 2002, contributing to a small drop in October passenger load factor to 74.6% as compared to 75.8% in September 2003.
-IATA-
International Traffic and Capacity
All figures are provisional and represent total reporting at time of publication plus estimates for missing data.

Notes for Editors
1. Explanation of measurements:
a. RPK: Revenue Passenger Kilometres measures actual passenger traffic
b. ASK: Available Seat Kilometres measures available passenger capacity
c. FTK: Freight Tonne Kilometres measures actual freight traffic
d. ATK: Available Tonne Kilometres measures available total capacity
2. IATA statistics cover international scheduled air traffic; domestic traffic is not included.