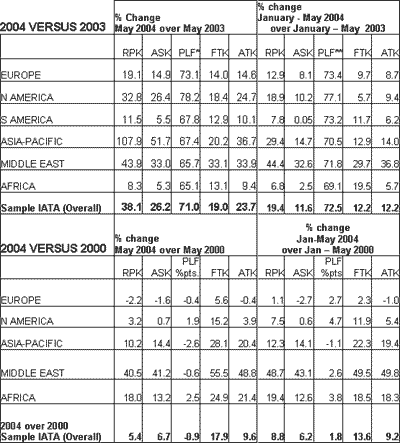
GENEVA – "Traffic growth for the first five months of 2004 is testimony to the resilience of air transport. Not only have we fully recovered from the impact of SARS and war in Iraq, all major regions of the world are reporting traffic levels above those of 2000—the last normal year for our industry," said Giovanni Bisignani, Director General and CEO of the International Air Transport Association (IATA).
Passenger traffic on all international routes was up by 38% in May 2004 as compared to May 2003. For Asian airlines alone the increase was even more extraordinary at 108% indicating a full traffic recovery from SARS. Overall, passenger traffic for the first five months of 2004 was up 19.4% over 2003, while freight traffic improved by 12.2% for the same period. More meaningfully, when 2004 data is compared to 2000 for the same 5-month period, global passenger and cargo traffic have risen to levels 8.8% and 13.6% higher respectively.
Despite the shocks that have rocked the airline industry in recent years, the underlying industry annual growth rate is 3.6%, according to recent IATA trend analysis. "Events beyond our control have clearly slowed the growth of the industry to half of what we experienced in the latter part of the 1990's. All things being equal, every 1% of growth adds US $1.6 billion to revenues on international services," said Bisignani.
"While oil prices have declined recently, every additional dollar over US$33/barrel generates US$1 billion industry losses. Efficiency gains and cost cutting remain priorities to return the industry to health. The IATA-led initiative to move the industry to 100% electronic ticketing by 2007 is an example of the serious approach that airlines are taking to cutting costs out of the system. Our partners in the value chain—particularly airports and air navigation service providers—must approach cost efficiency with equal resolve," said Bisignani.
May 2004 - Monthly International Statistics
* Refers to PLF in May 2004-06-28; ** refers to PLF Jan-May 2004
Notes for editors:
1. Explanation of measurements:
a. RPK: Revenue Passenger Kilometres measures actual passenger traffic
b. ASK: Available Seat Kilometres measures available passenger capacity
c. PLF: Passenger Load Factor is % of ASKs used.
d. FTK: Freight Tonne Kilometres measures actual freight traffic
e. ATK: Available Tonne Kilometres measures available total capacity (combined passenger and cargo)
2. IATA statistics cover international scheduled air traffic; domestic traffic is not included.
3. All figures are provisional and represent total reporting at time of publication plus estimates for missing data.
4. Due to uncertainties in the adoption of the new ICAO statistical definitions by reporting carriers, care should be taken when making year comparisons.
5. N.B. data unavailable for South America 2000-2004 comparison
IATA (International Air Transport Association) represents over 270 airlines comprising 95% of international scheduled air traffic.