GENEVA – "International passenger traffic growth in the first half of 2004 substantially exceeded our expectations. If current growth trends prevail, and barring any unforeseen event, we could end the year with double digit growth, surpassing our March expectation of 7.5% for the year," said Giovanni Bisignani, Director General and CEO of the International Air Transport Association (IATA).
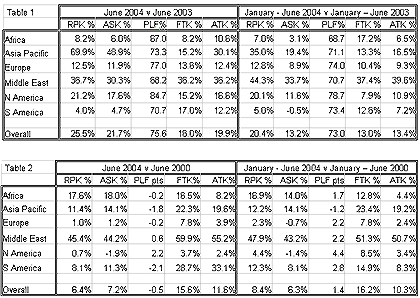
Results for the first six months of 2004 indicate increases of 20.4% in international passenger traffic and 13.0% in cargo over 2003. This growth outstrips the capacity expansion of 13.2%, resulting in a half-year passenger load factor of 73.0%. For June 2004 heightened capacity control resulted in a load factor of 75.6%.
The better-than-expected growth can be attributed primarily to three factors: improvement of the underlying traffic trends, a strong recovery from the SARS crisis and the impact of cyclical economic growth factors.
Compared with 2000, which was the last normal year for the industry, half-year traffic results are more sobering. International passenger traffic is up 8.4%, while cargo shows growth of 16.2%. The average load factor for the first six months of 2004 (73.0%) is 1.4 points above 2000 levels.
The high price of jet fuel continues to be the greatest threat to industry profitability. Oil prices remain approximately US$6 per barrel above anticipated levels for 2004, which adds up to US$6 billion in costs to the industry.
"The industry's traffic performance in recent months is impressive. If airlines can maintain strict control on their costs and capacity, the strong traffic recovery for this year could see the industry break even or better. Many urgent problems still challenge our business. We must continue our efforts to simplify business processes, push forward liberalisation and encourage efficiency and cost consciousness across the industry's value chain," said Bisignani.

Notes for editors:
1. IATA (International Air Transport Association) represents over 270 airlines comprising 95% of international scheduled air traffic.
2. Explanation of measurements:
a. RPK: Revenue Passenger Kilometres measures actual passenger traffic
b. ASK: Available Seat Kilometres measures available passenger capacity
c. PLF: Passenger Load Factor is % of ASKs used. In Table 1 PLF indicates % seats filled for months indicated. In Table 2, PLF indicates point differential between the periods compared.
d. FTK: Freight Tonne Kilometres measures actual freight traffic
e. ATK: Available Tonne Kilometres measures available total capacity (combined passenger and cargo)
3. IATA statistics cover international scheduled air traffic; domestic traffic is not included.
4. All figures are provisional and represent total reporting at time of publication plus estimates for missing data.
5. Due to uncertainties in the adoption of the new ICAO statistical definitions by reporting carriers, care should be taken when making year comparisons.