Translation:
El sector de carga aérea sube 3,5% en 2018. La demanda se debilita en diciembre (pdf)
Le fret finit l’année en hausse de 3,5 %, malgré le ralentissement à la fin de 2018 (pdf)
国际航协:2018 年全球航空货运需求同比增长 3.5% (pdf)
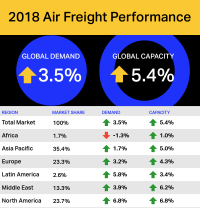
Geneva – The International Air Transport Association (IATA) released full-year 2018 data for global air freight markets showing that demand, measured in freight tonne kilometers (FTKs) grew by 3.5% compared to 2017. This was significantly lower than the extraordinary 9.7% growth recorded in 2017.
Freight capacity, measured in available freight tonne kilometers (AFTKs), rose by 5.4% in 2018, outpacing annual growth in demand. This exerted downward pressure on the load factor but yields proved resilient.
Air cargo’s performance in 2018 was sealed by a softening in demand in December. Year-on-year, December demand decreased by 0.5%. This was the worst performance since March 2016. Freight capacity, however, grew by 3.8%. This was the tenth month in a row that year-on-year capacity growth outstripped demand growth.
International e-commerce grew in 2018 which was a positive factor for the year. Yet, there was a softening of several key demand drivers:
- The restocking cycle, during which businesses rapidly built up inventories to meet demand, ended in early 2018;
- Global economic activity weakened;
- The export order books of all major exporting nations, with the exception of the US, contracted in the second half of 2018;
- Consumer confidence weakened compared to very high levels at the beginning of 2018.
“Air cargo demand lost momentum towards the end of 2018 in the face of weakening global trade, sagging consumer confidence and geopolitical headwinds. Still, demand grew by 3.5% compared to 2017. We are cautiously optimistic that demand will grow in the region of 3.7% in 2019. But with the persistence of trade tensions and protectionist actions by some governments there is significant downside risk. Keeping borders open to people and to trade is critical,” said Alexandre de Juniac, IATA’s Director General and CEO.
“To attract demand in new market segments, the air cargo industry must improve its value proposition. Enabling modern processes with digitalization will help build a stronger foothold in e-commerce and the transport of time- and temperature-sensitive goods such as pharmaceuticals and perishables,” said de Juniac.
| DECEMBER 2018 (% year-on-year) | World share1 | ftK | AStK | fLF (%-pt)2 | fLF (level)3 |
|---|---|---|---|---|---|
| Total Market | 100.0% | -0.5% | 3.8% | -2.1% | 48.8% |
| Africa | 1.7% | -2.2% | 4.9% | -2.8% | 38.1% |
| Asia Pacific | 35.4% | -4.5% | 2.6% | 4.1% | 54.0% |
| Europe | 23.3% | 1.9% | 3.7% | -1.0% | 56.7% |
| Latin America | 2.6% | -0.1% | 6.0% | -1.8% | 29.1% |
| Middle East | 13.3% | 0.1% | 4.5% | -2.1% | 48.8% |
| North America | 23.7% | 2.9% | 4.5% | -0.6% | 41.4% |
Regional Performance
Airlines in all regions with the exception of Africa reported an annual increase in demand in 2018.
Asia-Pacific carriers posted the weakest growth of any region in December 2018 with a decrease in demand of 4.5% compared to the same period a year earlier. Capacity increased by 2.6%. The weaker performance in December contributed to growth in freight demand of only 1.7% in 2018 compared to 2017. Annual capacity increased 5.0%. The weaker performance of Asia-Pacific carriers in 2018 largely reflects a slowing in demand for exports from the region’s major exporters (China, Japan and Korea). Signs of a moderation in economic activity in China and an escalation of trade tensions continue to pose a downside risk to air cargo in Asia-Pacific.
North American airlines posted the fastest growth of any region for the seventh consecutive month in December 2018 with an increase in demand of 2.9% compared to the same period a year earlier. Capacity increased by 4.5%. This contributed to an annual growth in demand in 2018 of 6.8%, matching the rate of capacity increase. The strength of the US economy and consumer spending have helped support the demand for air cargo over the past year, benefiting US carriers.
European airlines posted a 1.9% year-on-year increase in freight demand in December 2018 and a capacity rise of 3.7%. The improved performance in December contributed to an annual growth in demand for air cargo of 3.2% in 2018. Capacity increased by 4.3% in the same year. Weaker manufacturing conditions for exporters, particularly in Germany, one of Europe’s key export markets, along with mixed economic indicators impacted demand in 2018.
Middle Eastern carriers’ freight volumes increased 0.1% year-on-year in December and capacity increased 4.5%. This contributed to an annual increase in demand of 3.9% in 2018 – the third fastest growth rate of all the regions. Annual capacity increased 6.2%. The region continues to be affected by geopolitical issues.
Latin American airlines experienced a decrease in year-on-year demand of 0.1% in December after three months of positive growth. Capacity increased by 6.0%. Despite a decrease in demand, it’s worth noting that the within South America market continues to perform strongly, with international demand up almost 20% year-on-year. Annual growth in freight demand among Latin America carriers in 2018 increased by 5.8% - the second fastest of all regions. Annual capacity increased 3.4% in 2018.
African carriers’ saw freight demand decrease by 2.2%, in December 2018, compared to the same month in 2017. This was significantly less than the 9.4% decrease the previous month. Capacity increased by 4.9% year-on-year. It’s worth noting that seasonally-adjusted international freight volumes, despite being 7.7% lower than their peak in mid-2017, are still 50% higher than their most recent trough in late-2015. Annual growth in freight demand among Africa carriers in 2018 decreased by 1.3% and capacity grew by 1%.

Check out the 2018 Air Freight infographic for a quick overview.
Read the full December 2018 freight analysis (pdf)
For more information, please contact:
Corporate Communications
Tel: +41 22 770 2967
Email: corpcomms@iata.org
Notes for Editors:
- IATA (International Air Transport Association) represents some 290 airlines comprising 82% of global air traffic.
- Explanation of measurement terms:
- FTK: freight tonne kilometers measures actual freight traffic
- AFTK: available freight tonne kilometers measures available total freight capacity
- FLF: freight load factor is % of AFTKs used
- IATA statistics cover international and domestic scheduled air freight for IATA member and non-member airlines.
- Total freight traffic market shares by region of carriers in terms of FTK are: Asia-Pacific 35.4%, Europe 23.3%, North America 23.7%, Middle East 13.3%, Latin America 2.6%, Africa 1.7%.
