This Jet Fuel Price Monitor provides the latest price data from the leading energy information provider Platts. The Jet Fuel Price Index and price data show the average prices paid at the refinery for aviation jet fuel for the reported week.
Please note that we are unable to provide historical price data; for additional fuel price information visit the Platts jet fuel microsite.
For any questions relating to this analysis, please contact the IATA Fuel Team: fuelteam@iata.org
Fuel Price Analysis
The global average jet fuel price last week rose 12.6% compared to the week before to $197.00/bbl.
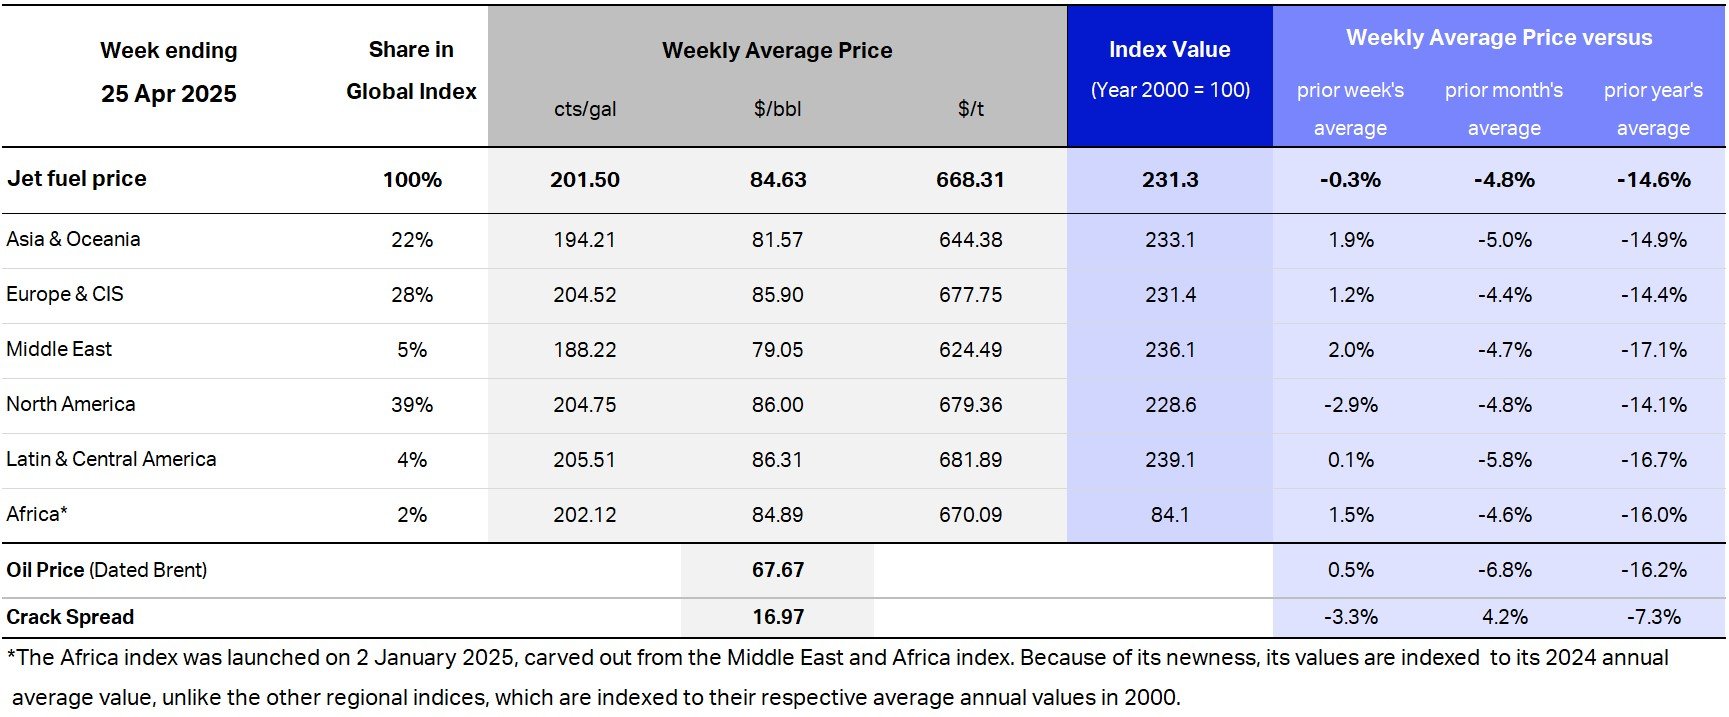
Recent Jet Fuel Price Development
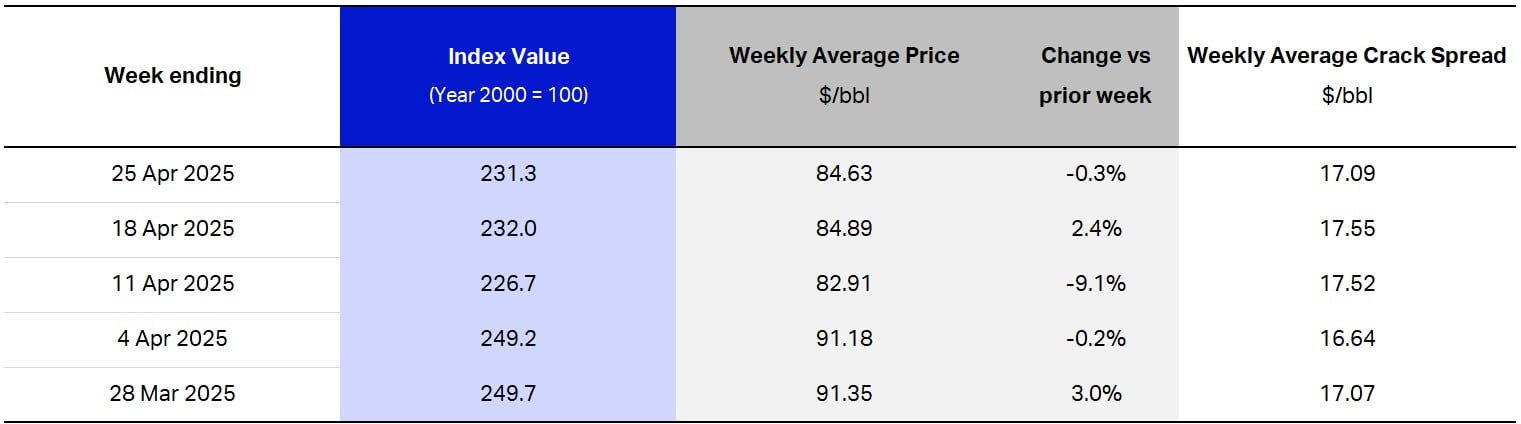
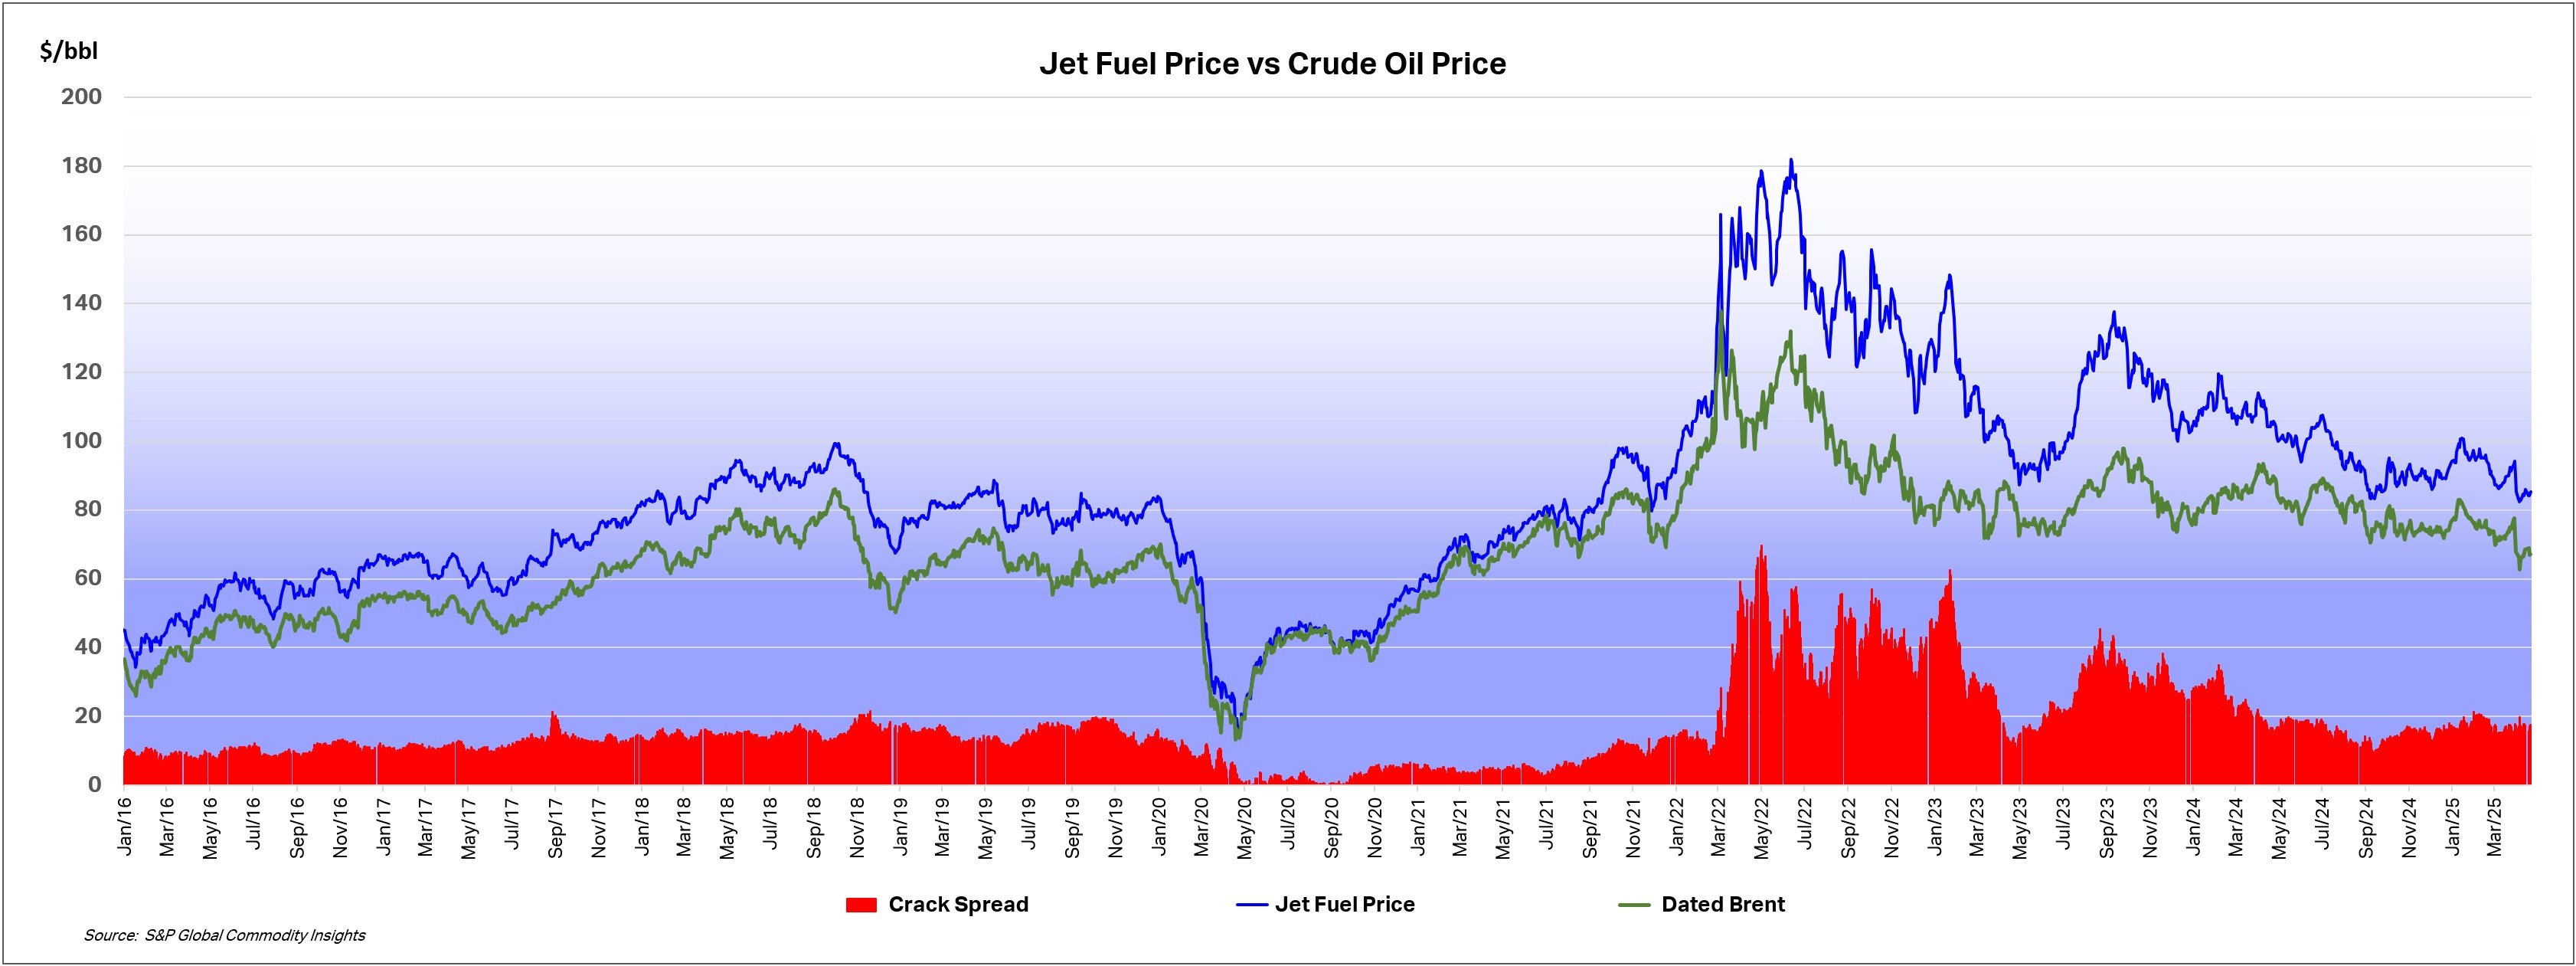
Taking a Look at the Price Action over the Past 24 Months
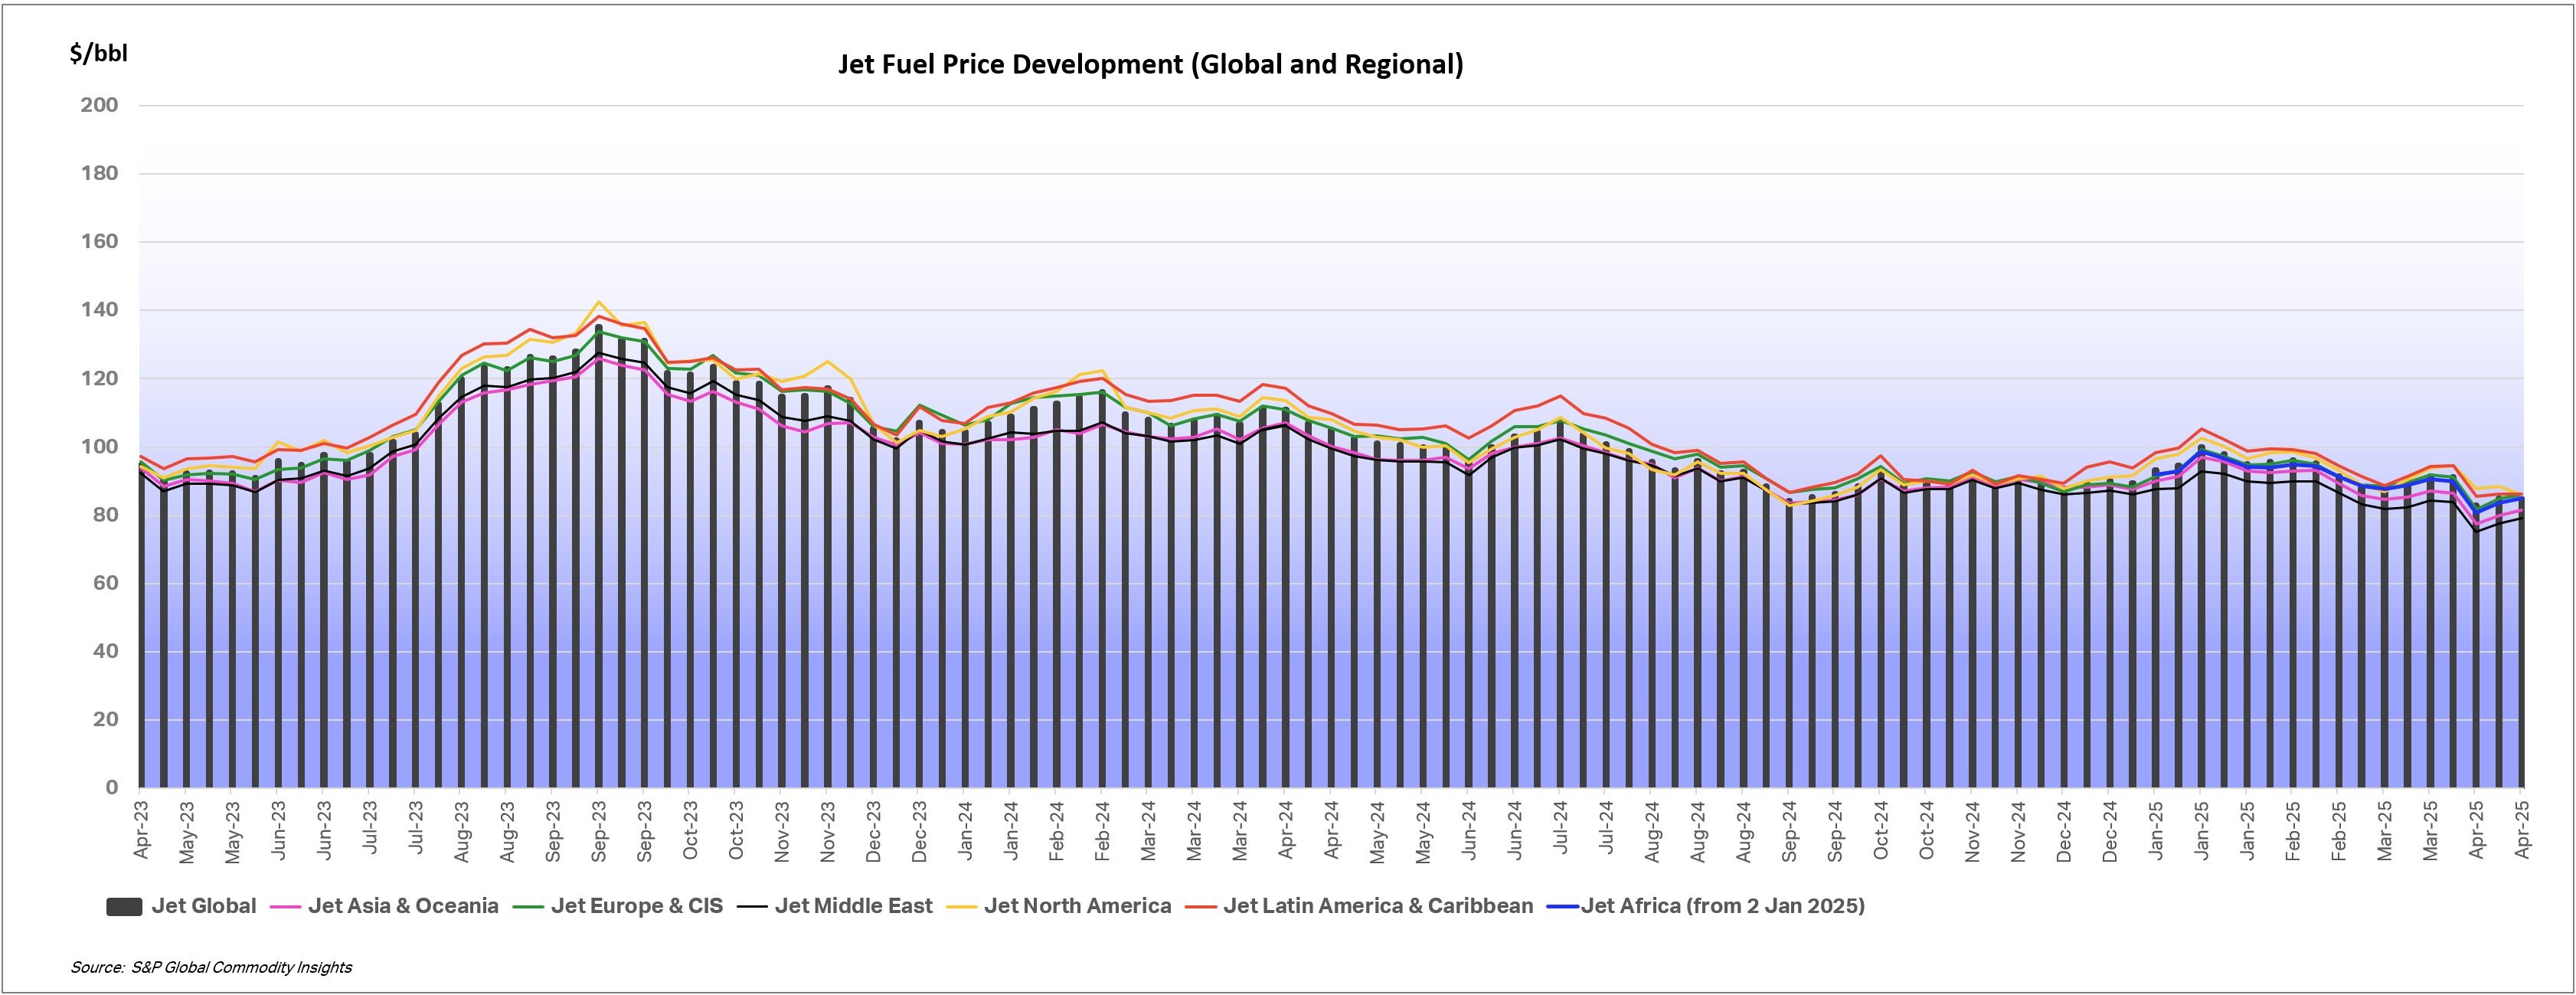
Jet Fuel Price Developments - Longer Term Perspective
Disclaimer
Source: © 2026 by (Platts) S&P Global Energy, a division of S&P Global Inc. All rights reserved. SPGE, its affiliates and licensors do not guarantee the adequacy, accuracy, timeliness and/or completeness of the data and information and make no warranties, express or implied, as to the results to be obtained by any person or entity from use of the data and information for investment, trading, risk management or any other decision. SPGE and its affiliates and licensors make no warranties, express or implied, and hereby disclaim all warranties of merchantability or fitness for a particular purpose or use with respect to the data and information. Without limiting any of the foregoing, in no event shall SPGE, its affiliates and licensors have any liability for any indirect, punitive, special, incidental or consequential damages (including but not limited to lost profits, trading losses, lost time or goodwill), even if notified of the possibility of such damages, whether in contract, tort, strict liability or otherwise.
The above data is published by the International Air Transport Association (IATA) under license from S&P Global Energy. IATA does not verify, audit or independently validate the data and provides it solely for general informational purposes. IATA makes no representations or warranties of any kind in relation to the data and accepts no liability for any loss, damage or expense arising from its use or reliance upon it. The data does not constitute financial, investment, trading or commercial advice and should not be relied upon for making business or contractual decisions.
Methodology for Platts Jet Fuel Price Index
Platts Jet Fuel Price Index is published by S&P Global Energy Platts, reflecting its daily assessments of jet fuel spot prices in the physical spot market of relevant regional centers. When a market is not assessed on a particular day, for instance because of a market holiday, the previous working day's spot market price assessment is used.
Each of the individual Platts' assessments is given a weighting by Platts in the regional baskets, based primarily on demand for jet fuel in the region; in a similar way, each of the regional indices is given a weighting in the Global Composite Index.
These values are compared with the average spot prices in 2000, similarly weighted by demand during that period, to generate a percentage figure reflecting the overall rise in markets compared to the base period. As an example, an index value of 200 reflects a doubling of price since the year 2000.
The full detail of the methodology can be found on the S&P Global Energy Platts website.
Please note that all aspects of the Jet Fuel Price Index methodology and data, including the underlying data, are the intellectual property of S&P Global Platts, a division of S&P Global Energy.