


Aviation industry data-driven insights
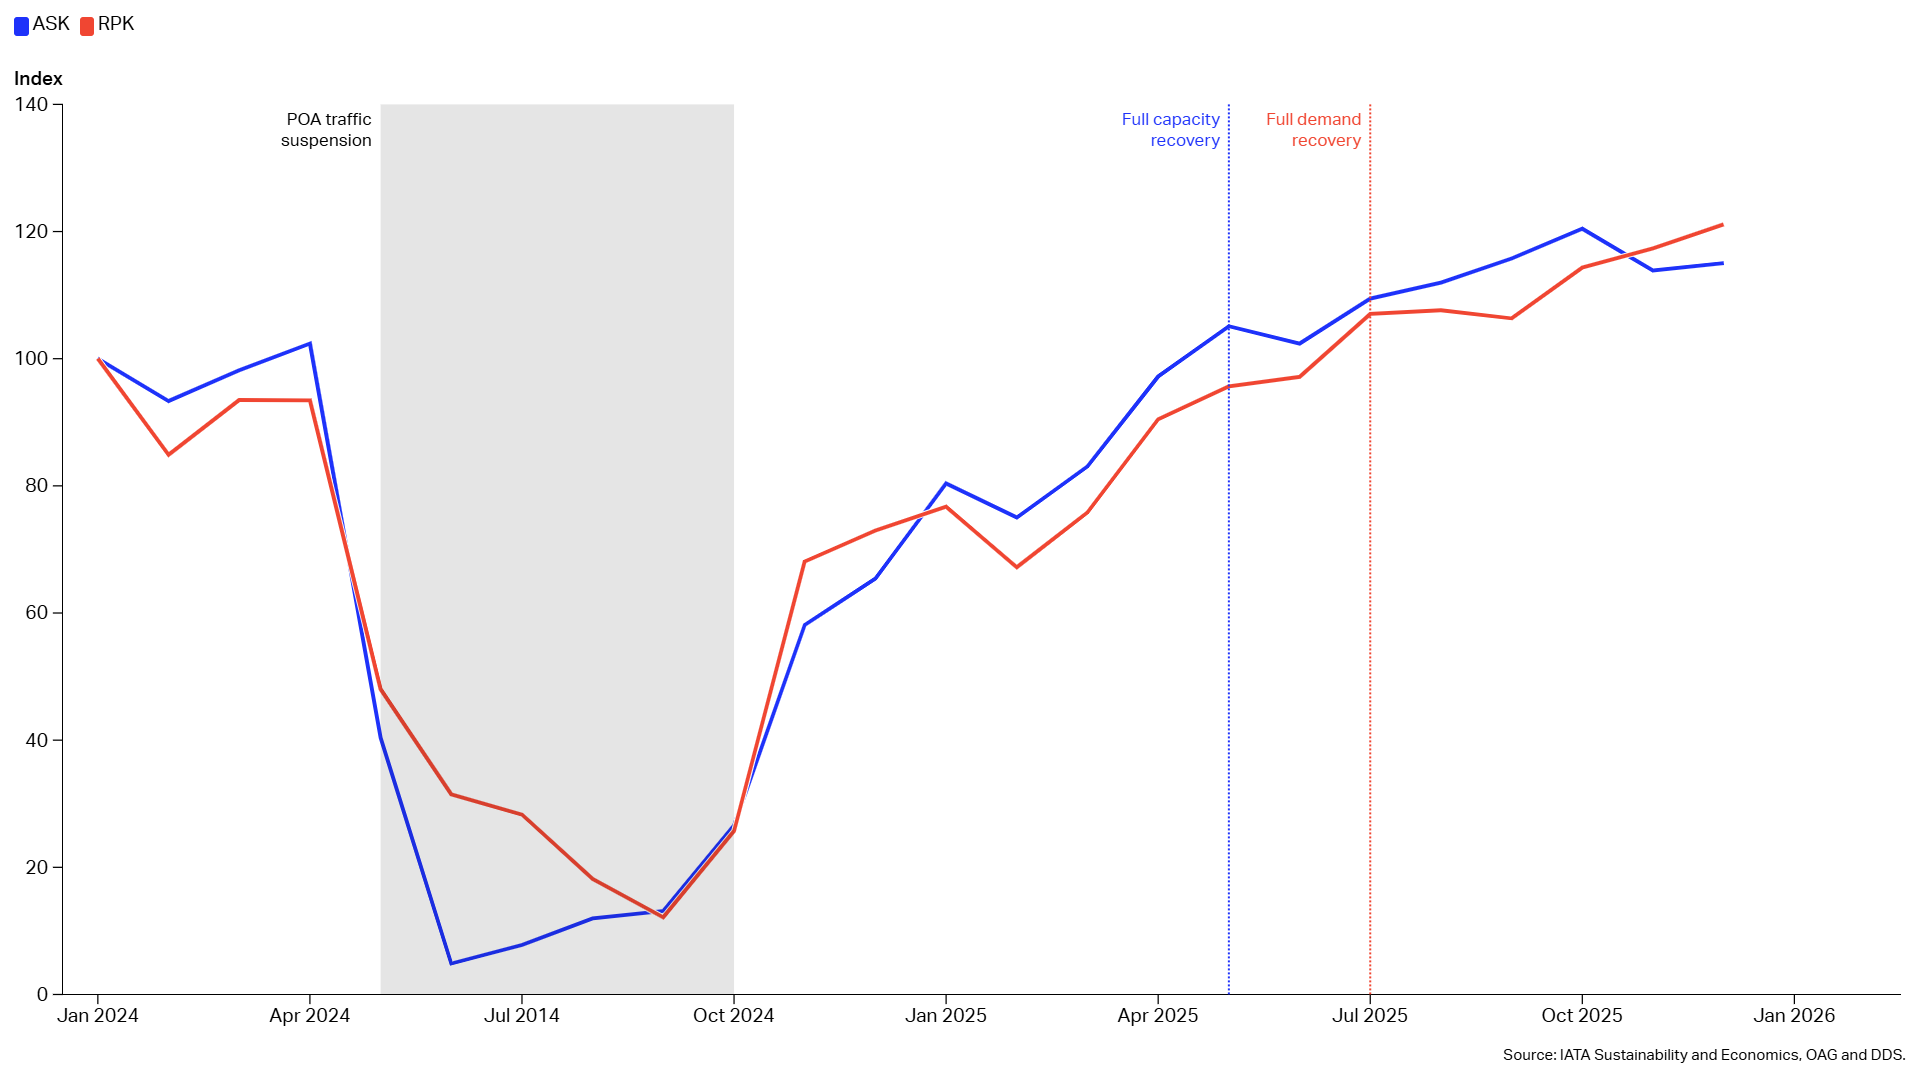
How Porto Alegre Bounced Back After Brazil’s Largest Airport Disruption
10 July 2026
In May 2024, severe floods and landslides affected Rio Grande do Sul in southern Brazil. Considered the country's worst disaster in 80 years, the event severely disrupted the Porto Alegre-Salgado Filho International Airport (POA), the main airport in the region and one of the largest in the country.
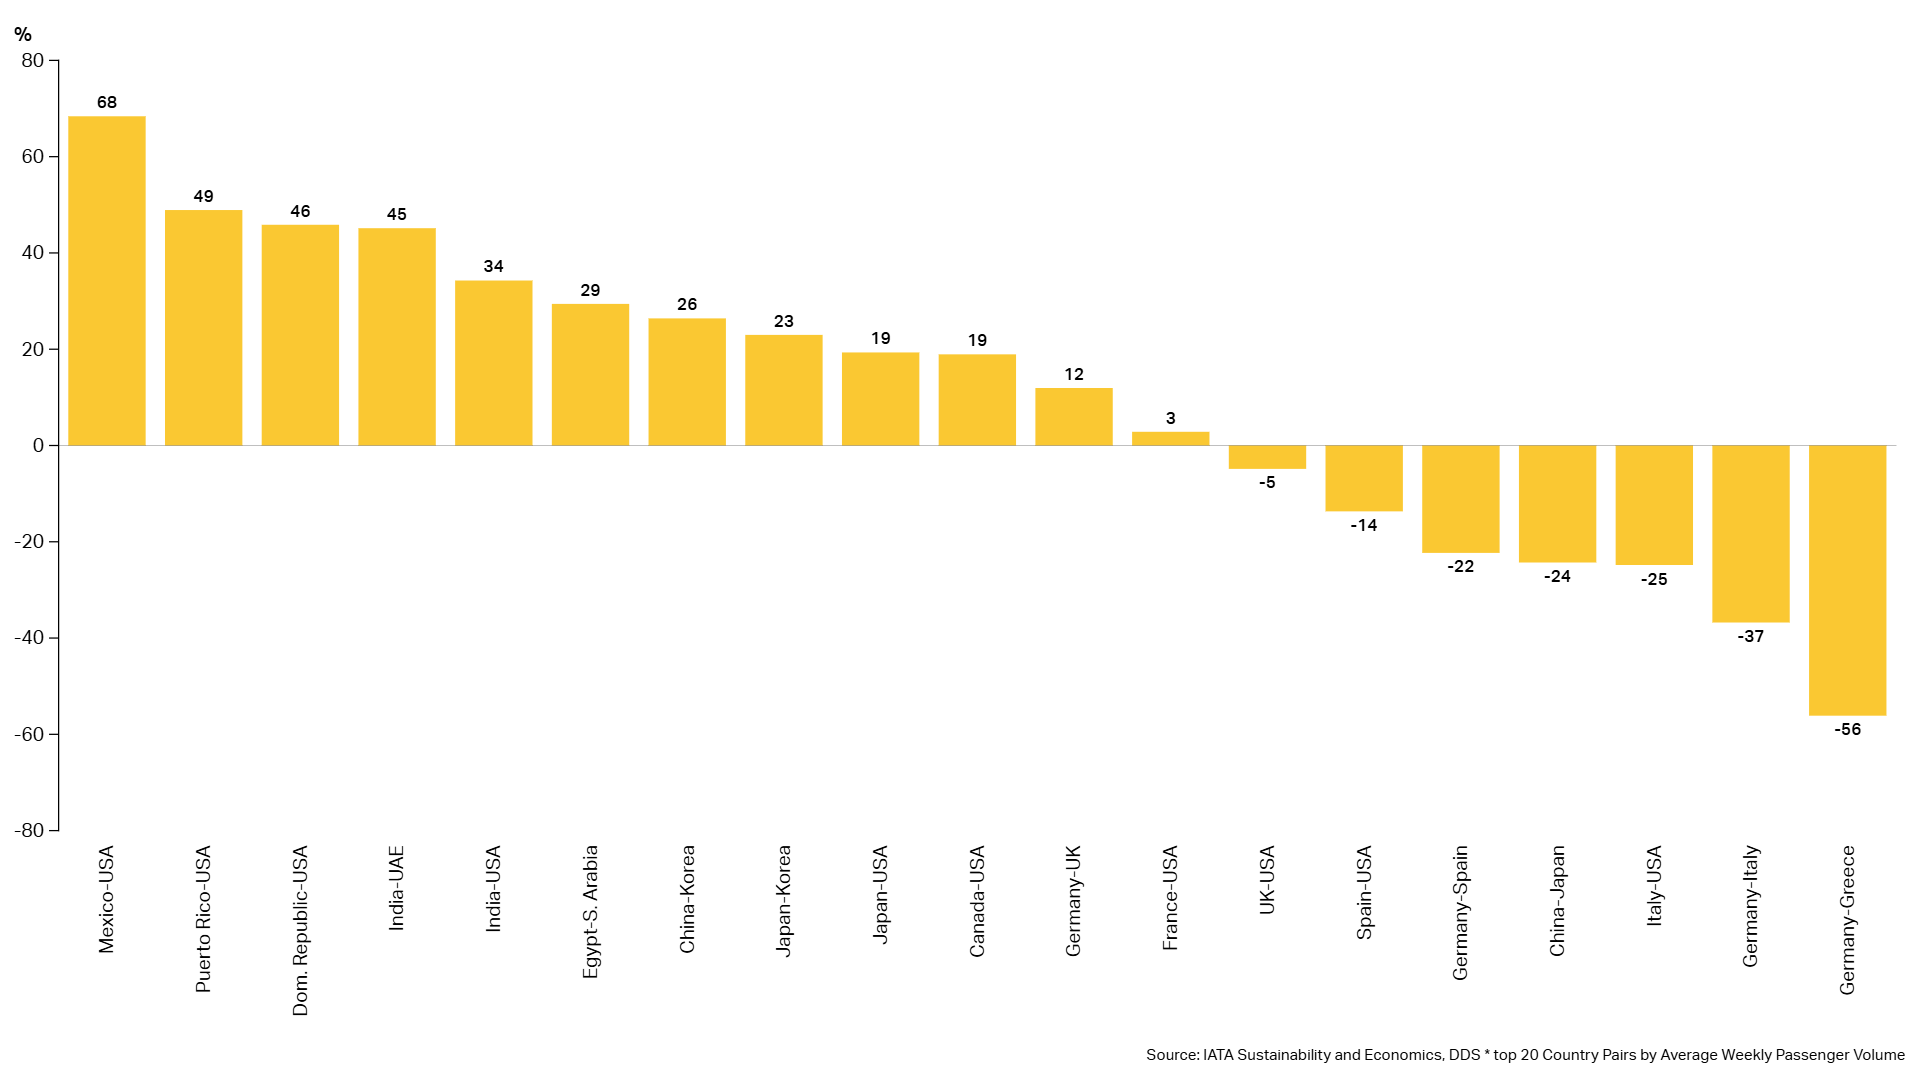
Ticket Bookings Showing Mixed Signs of Demand Impact From the Middle East Crisis
3 July 2026
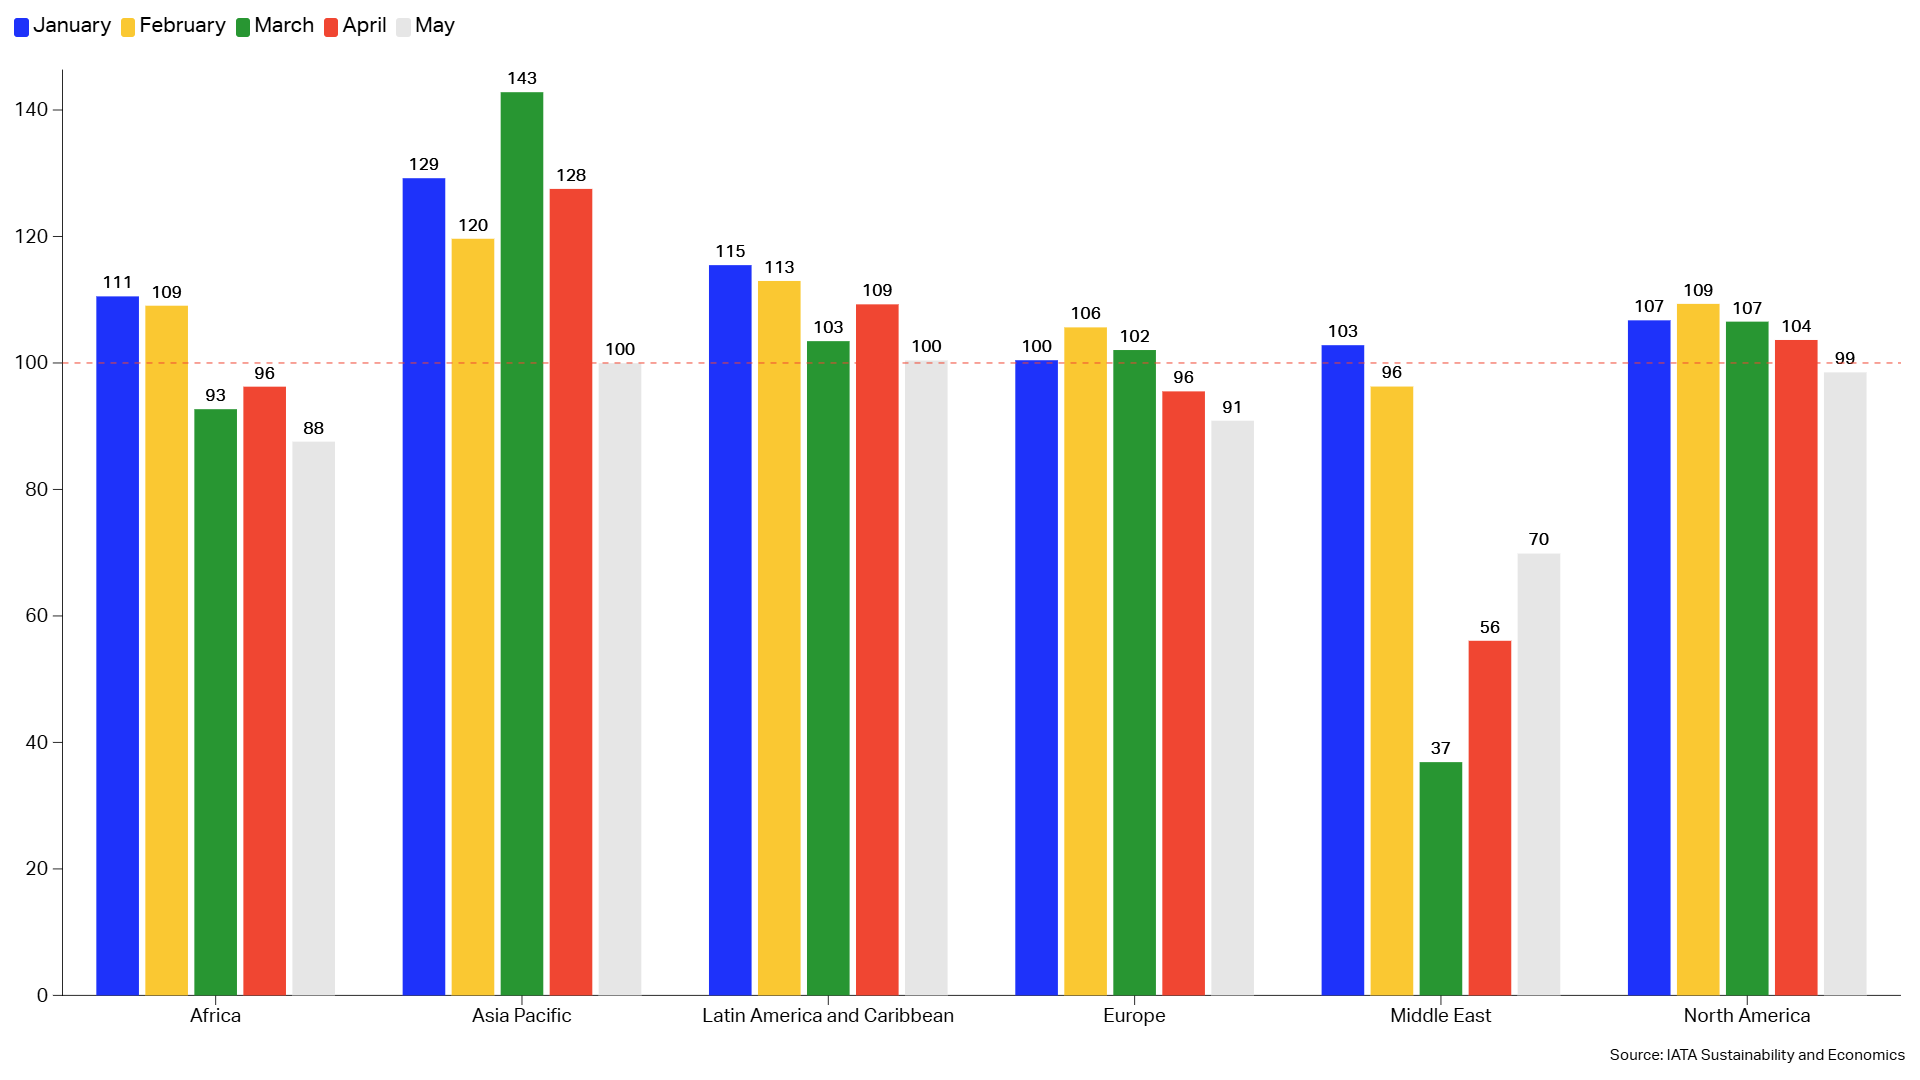
Ticket bookings for the summer months between June and September 2026 suggest that air travel to the Middle East region is gradually recovering from the sharp decline of 63% recorded in March following the escalation of the Iran conflict on 28 February 2026.
A Third of Announced SAF Capacity May Never Take Off
26 June 2026

Around 200 SAF projects have been announced globally, representing up to 30 Mt of production capacity by 2030.
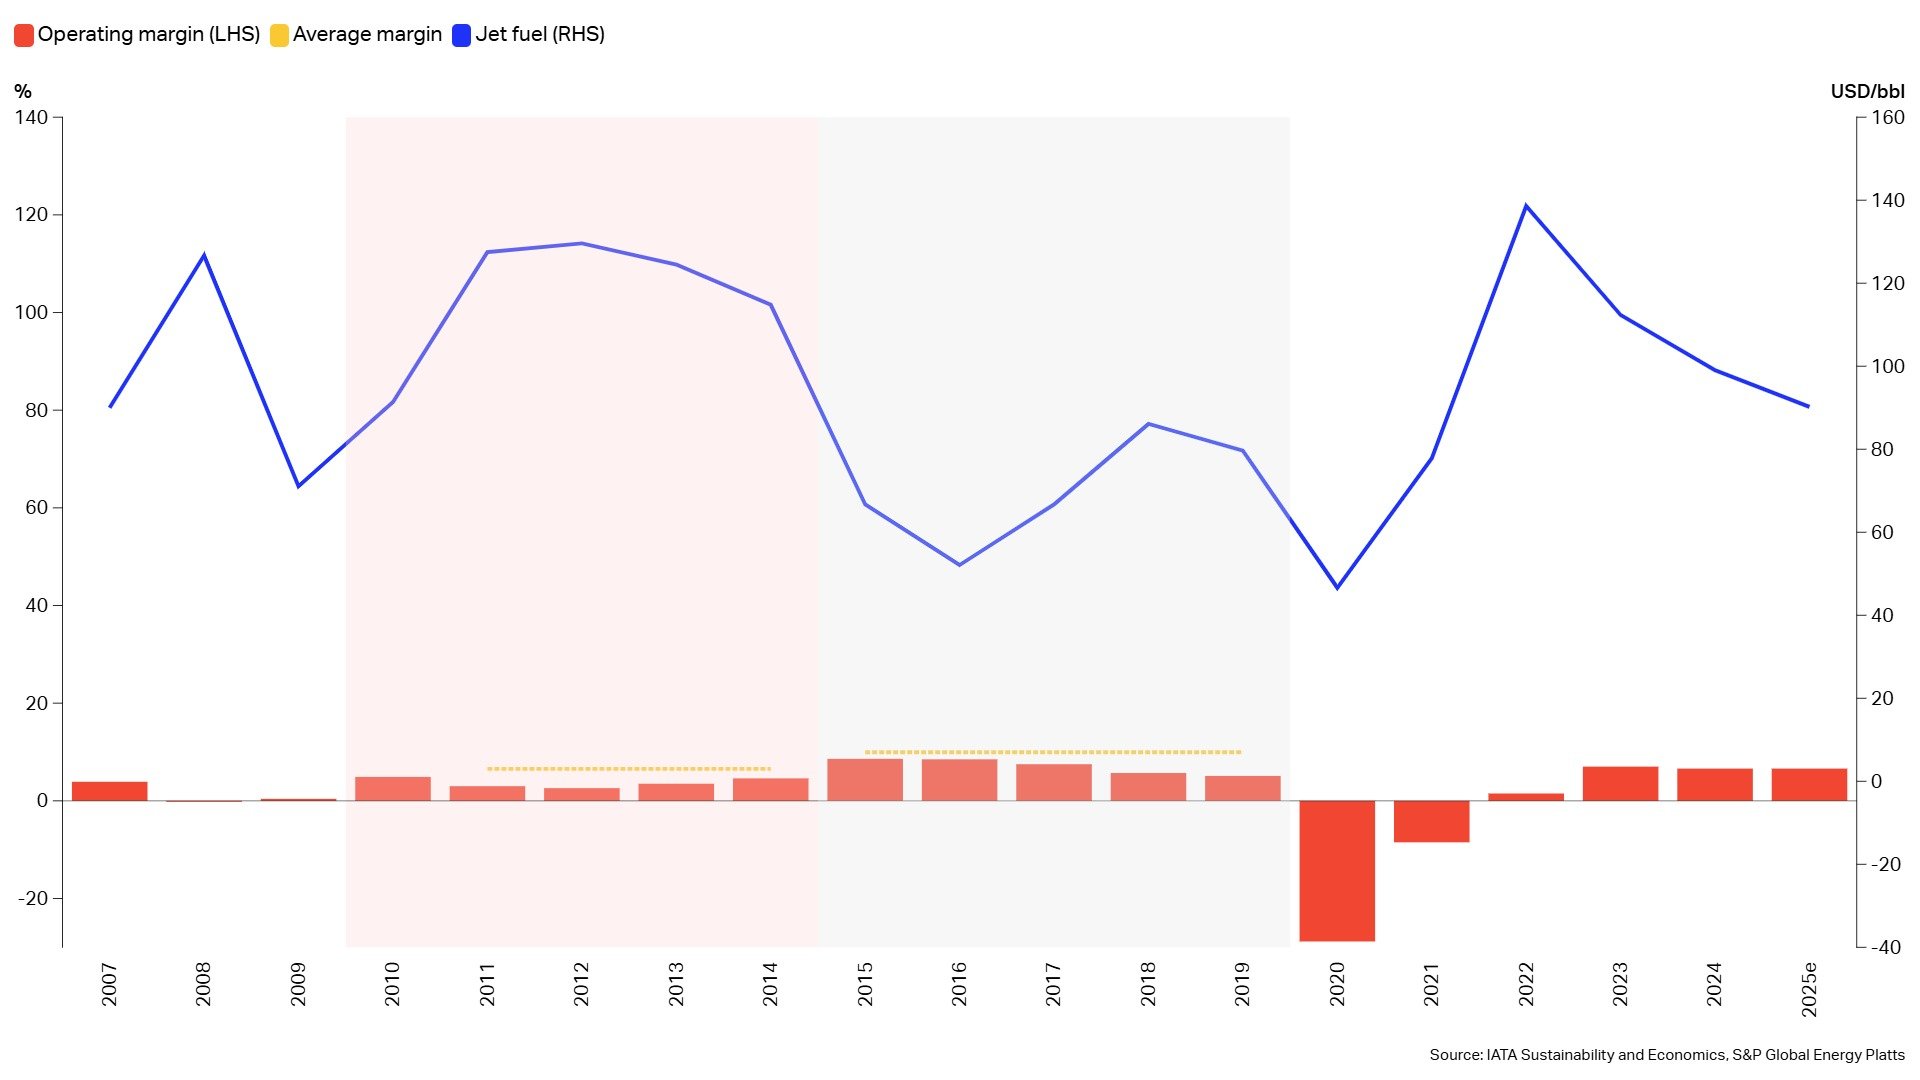
Profits and Margins to Shrink in 2026 - but Remain Positive
19 June 2026
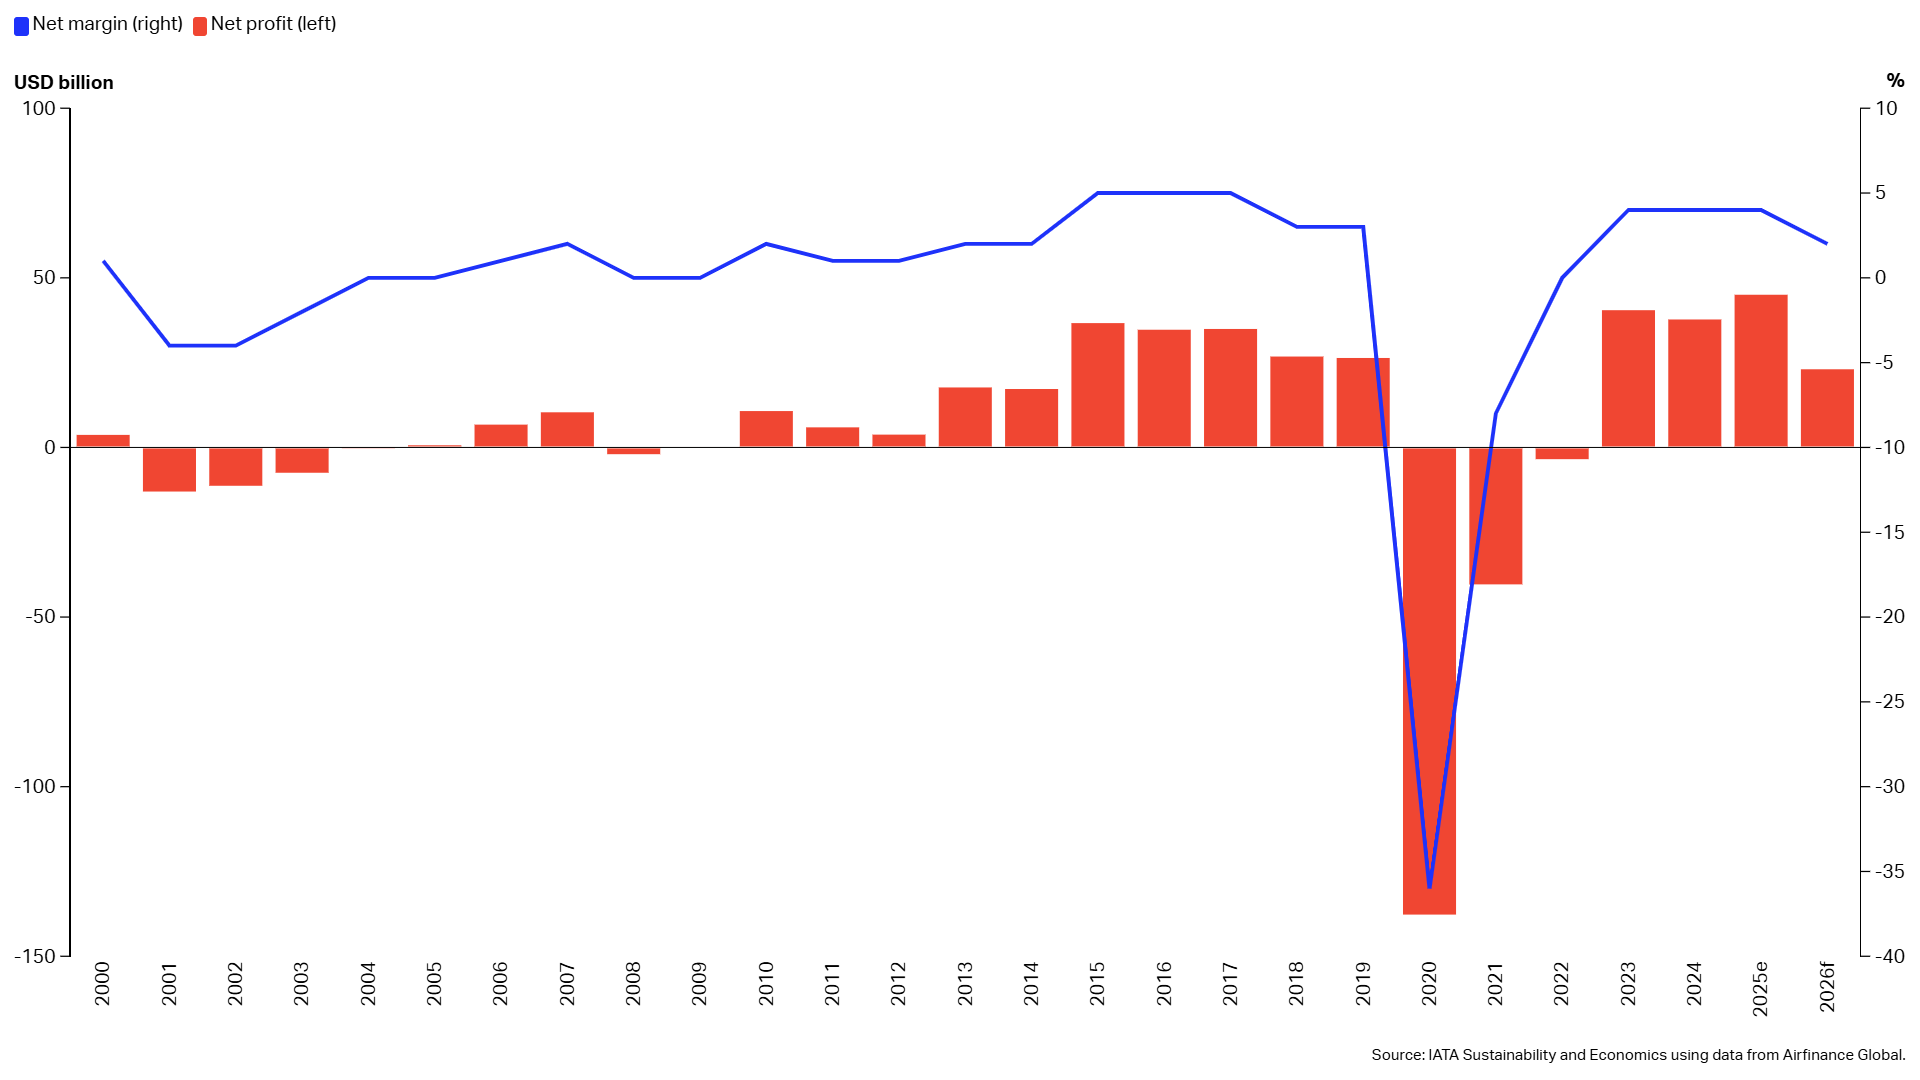
Faced with record jet fuel prices and the major disruption in traffic in the Middle East, the air transport industry is still expected to remain profitable in aggregate in 2026.
Global Air Travel Demand to Slow to 2.1% in 2026
12 June 2026
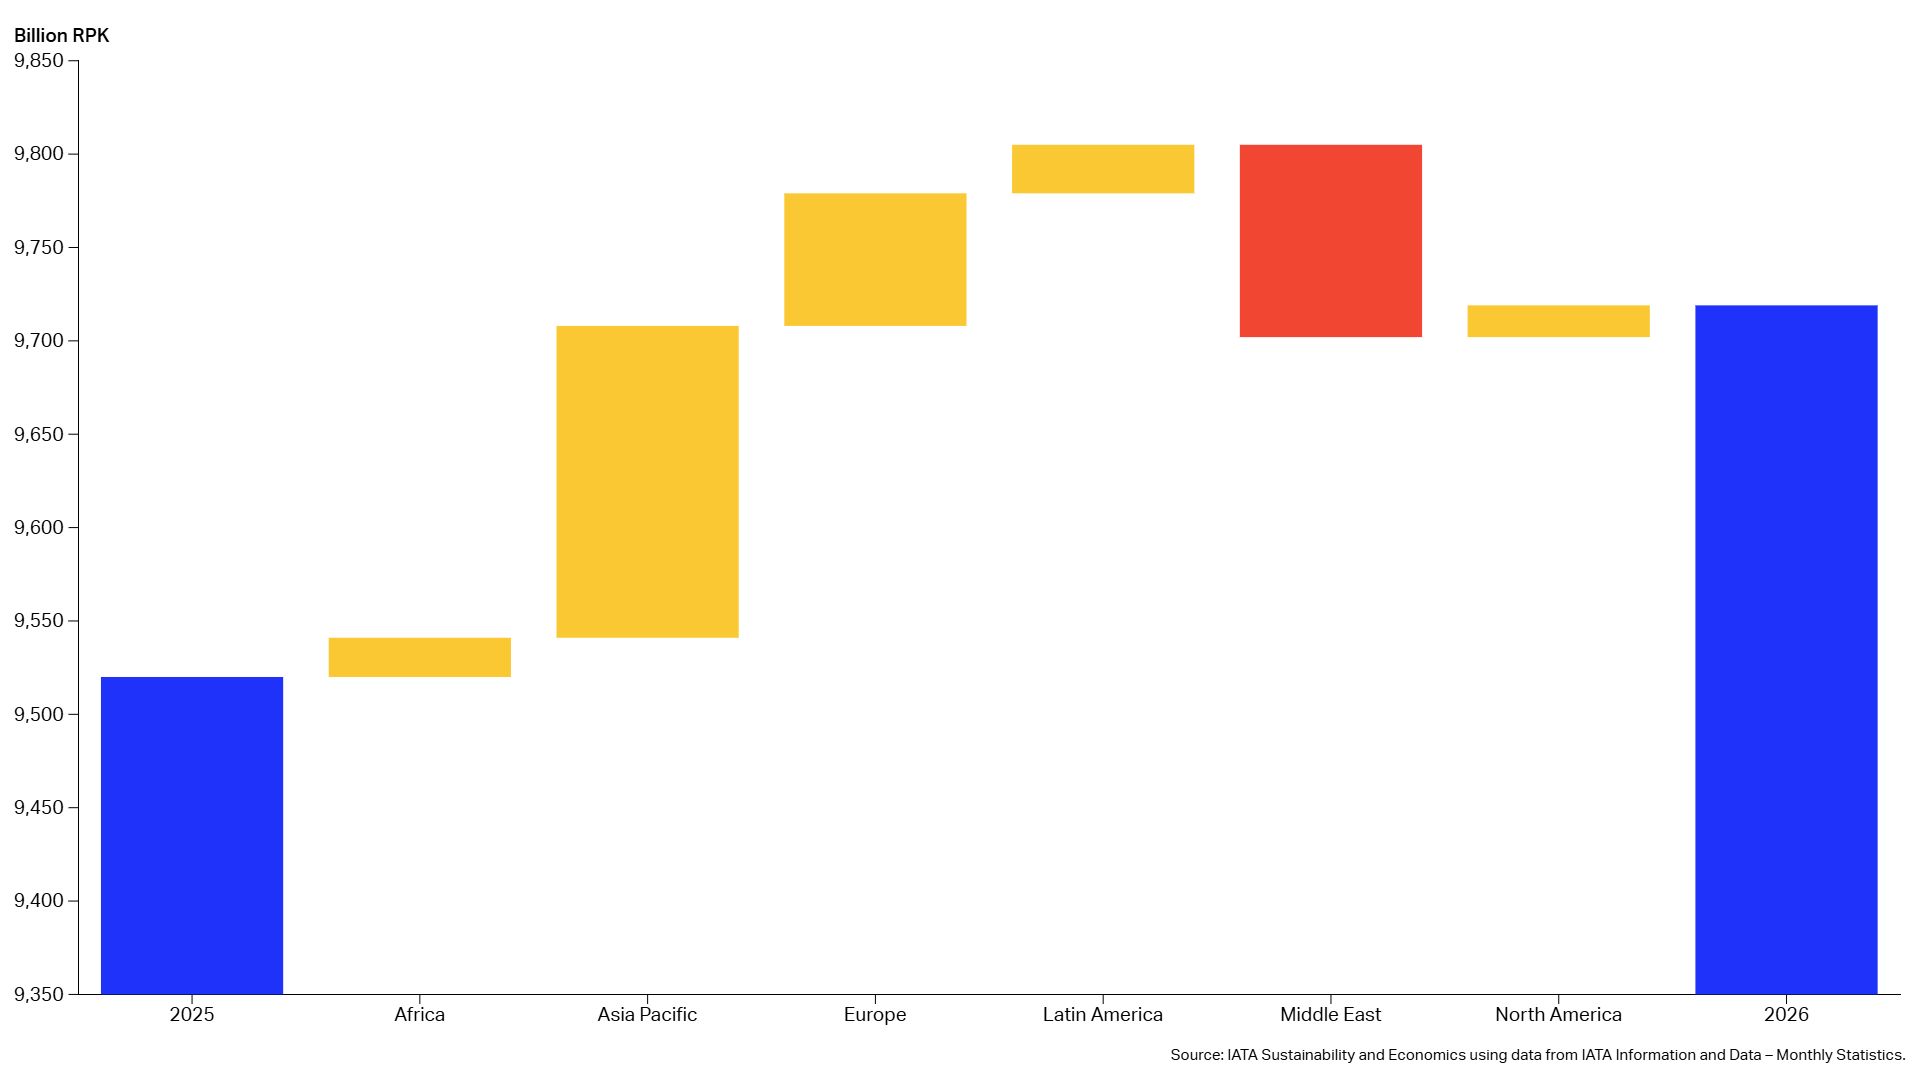
Global air passenger demand is set to expand in 2026, but at a significantly slower pace than in recent years.
Global Football Fans Move Early, But Not Evenly
5 June 2026
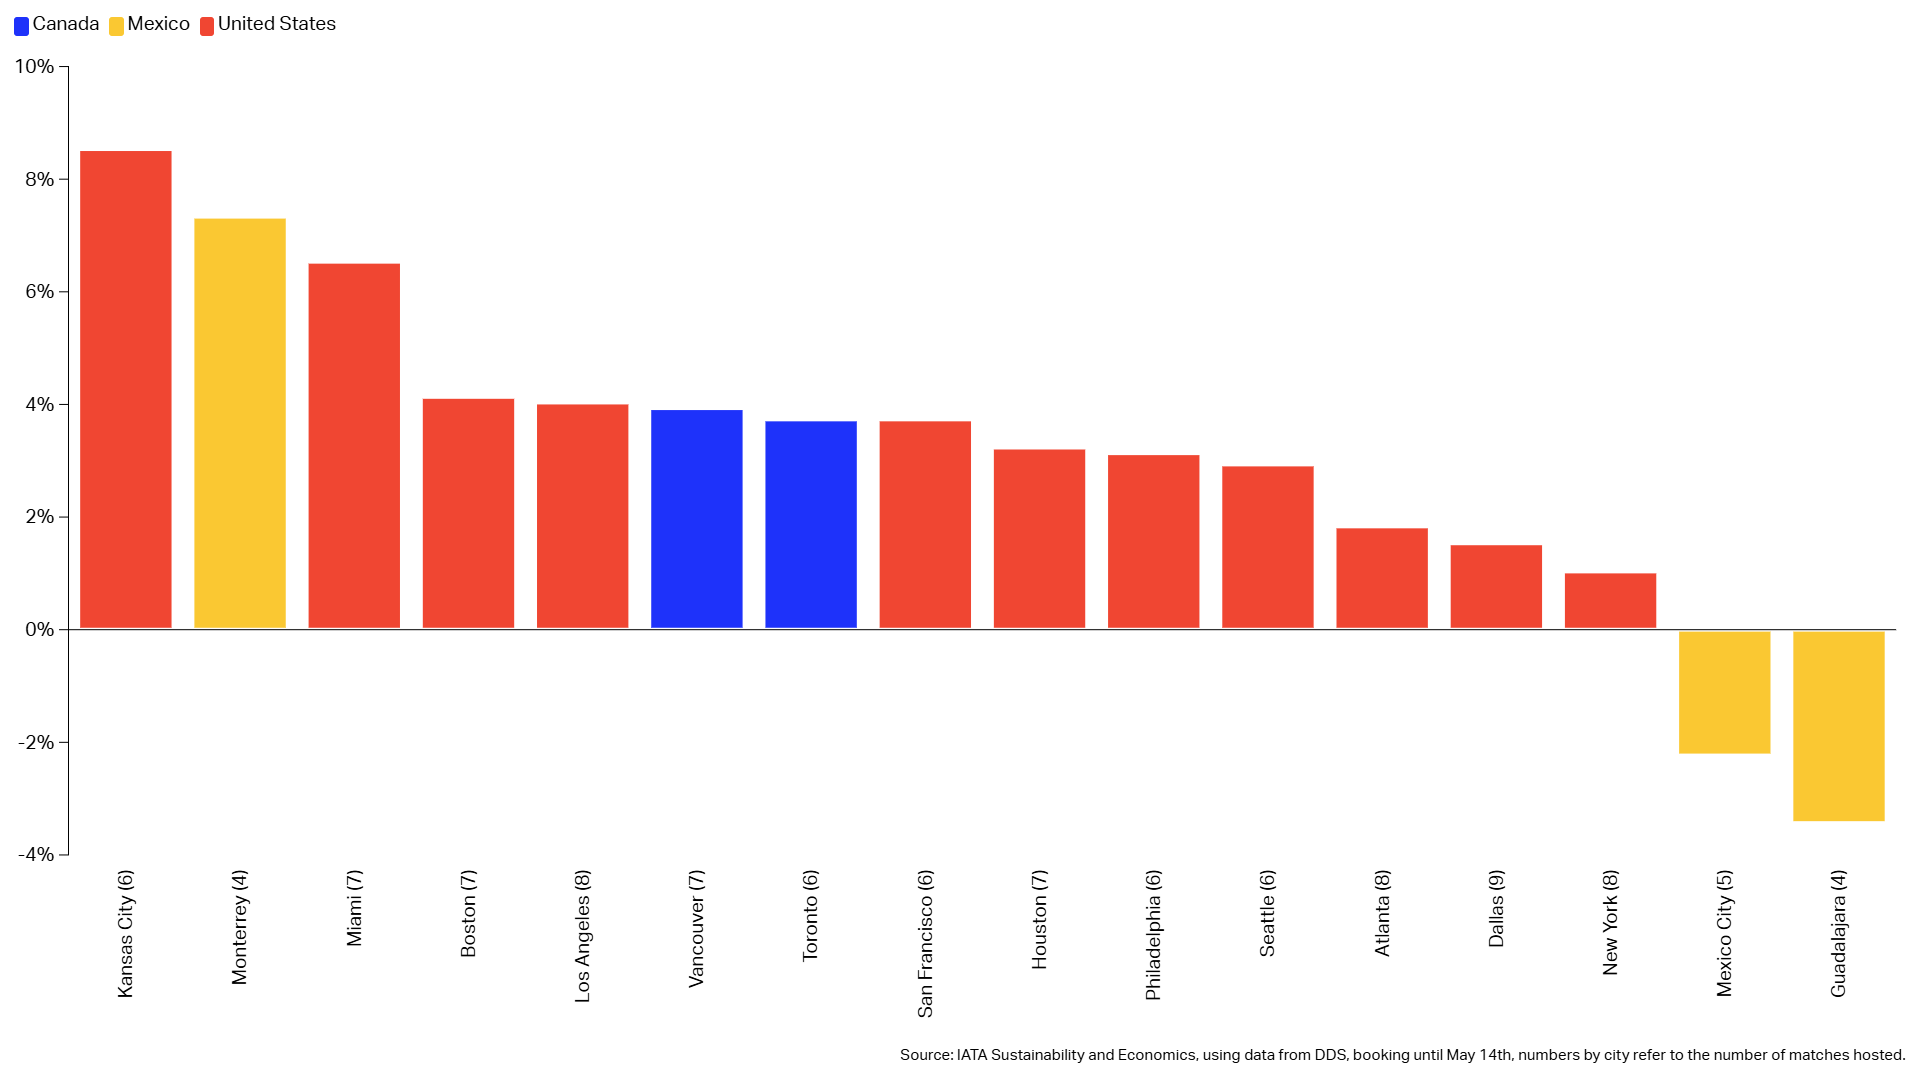
This summer, the world's most-watched sporting event comes to North America.
Central Asia’s Growing Role in Global Air Cargo Flows
29 May 2026
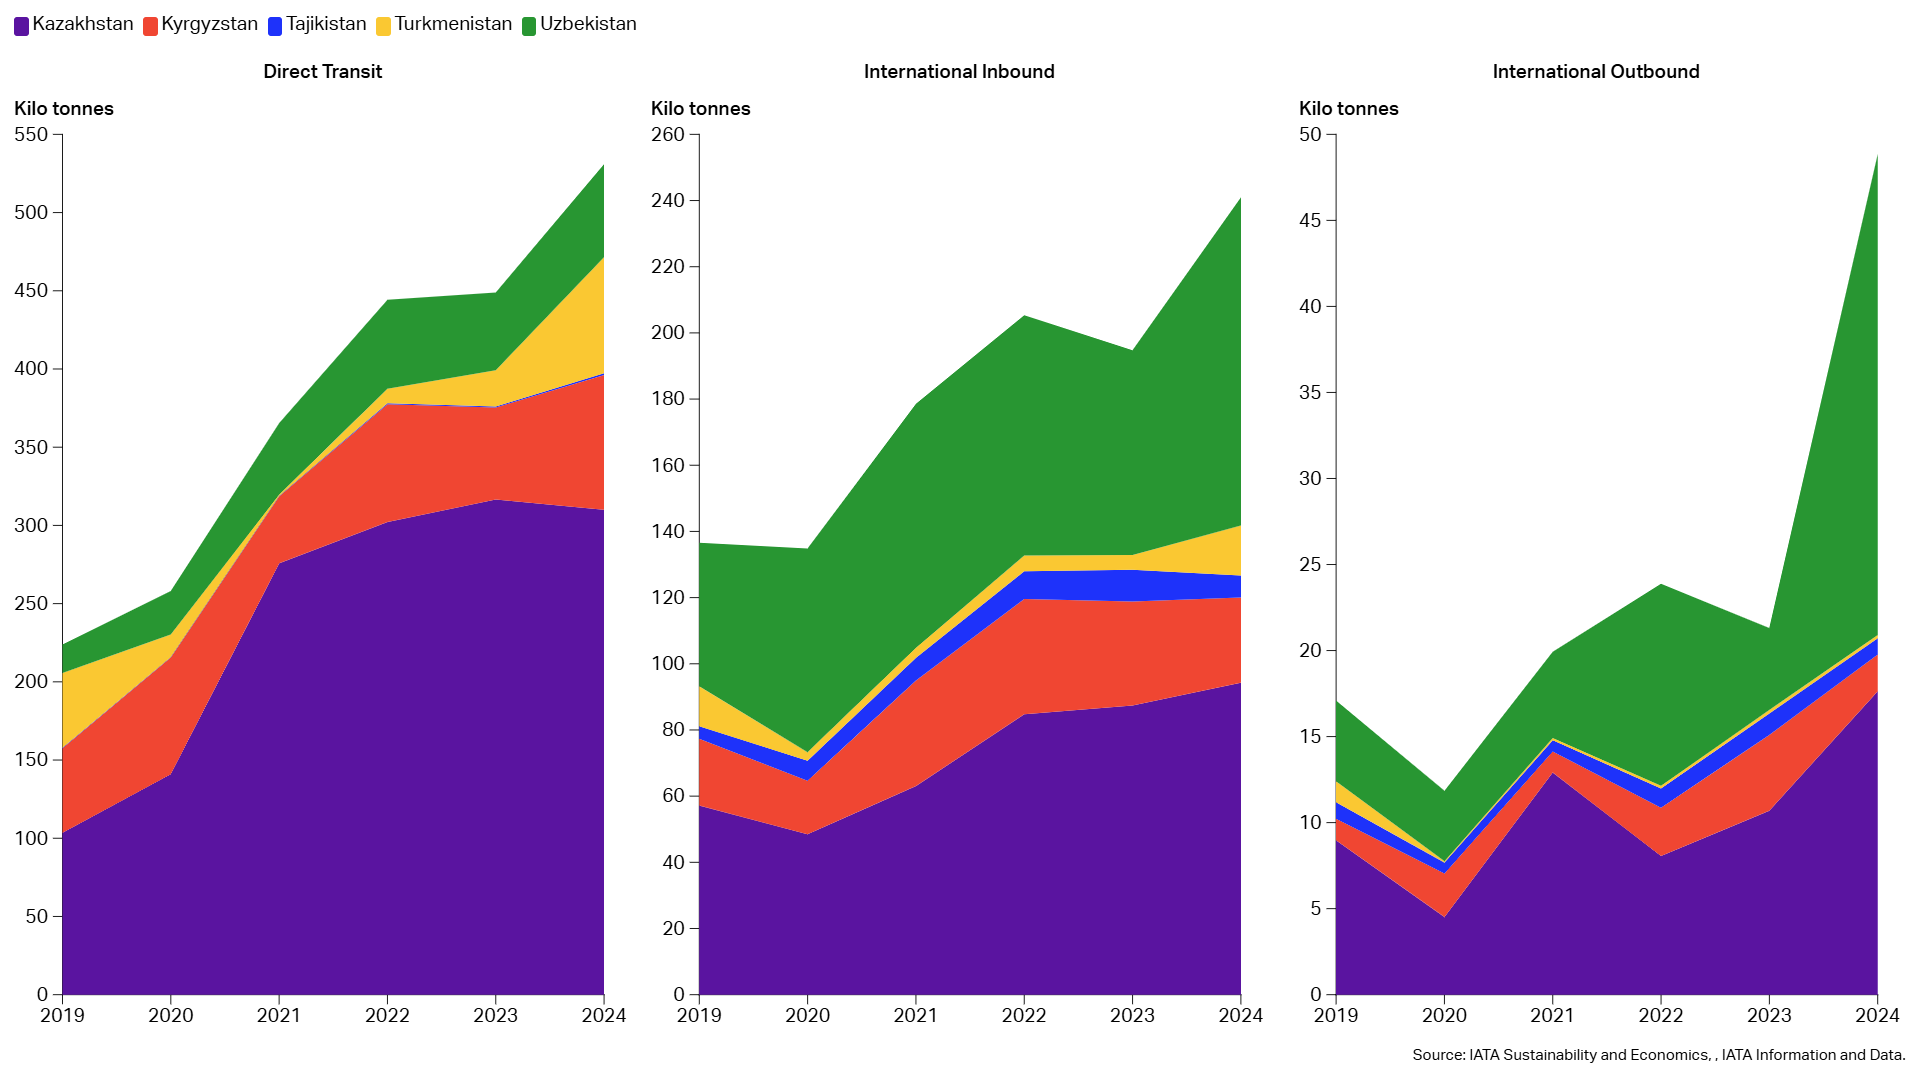
The global air cargo map is evolving with new corridors growing in importance.
Travelers Opt to Stay Closer to Home This Summer
22 May 2026
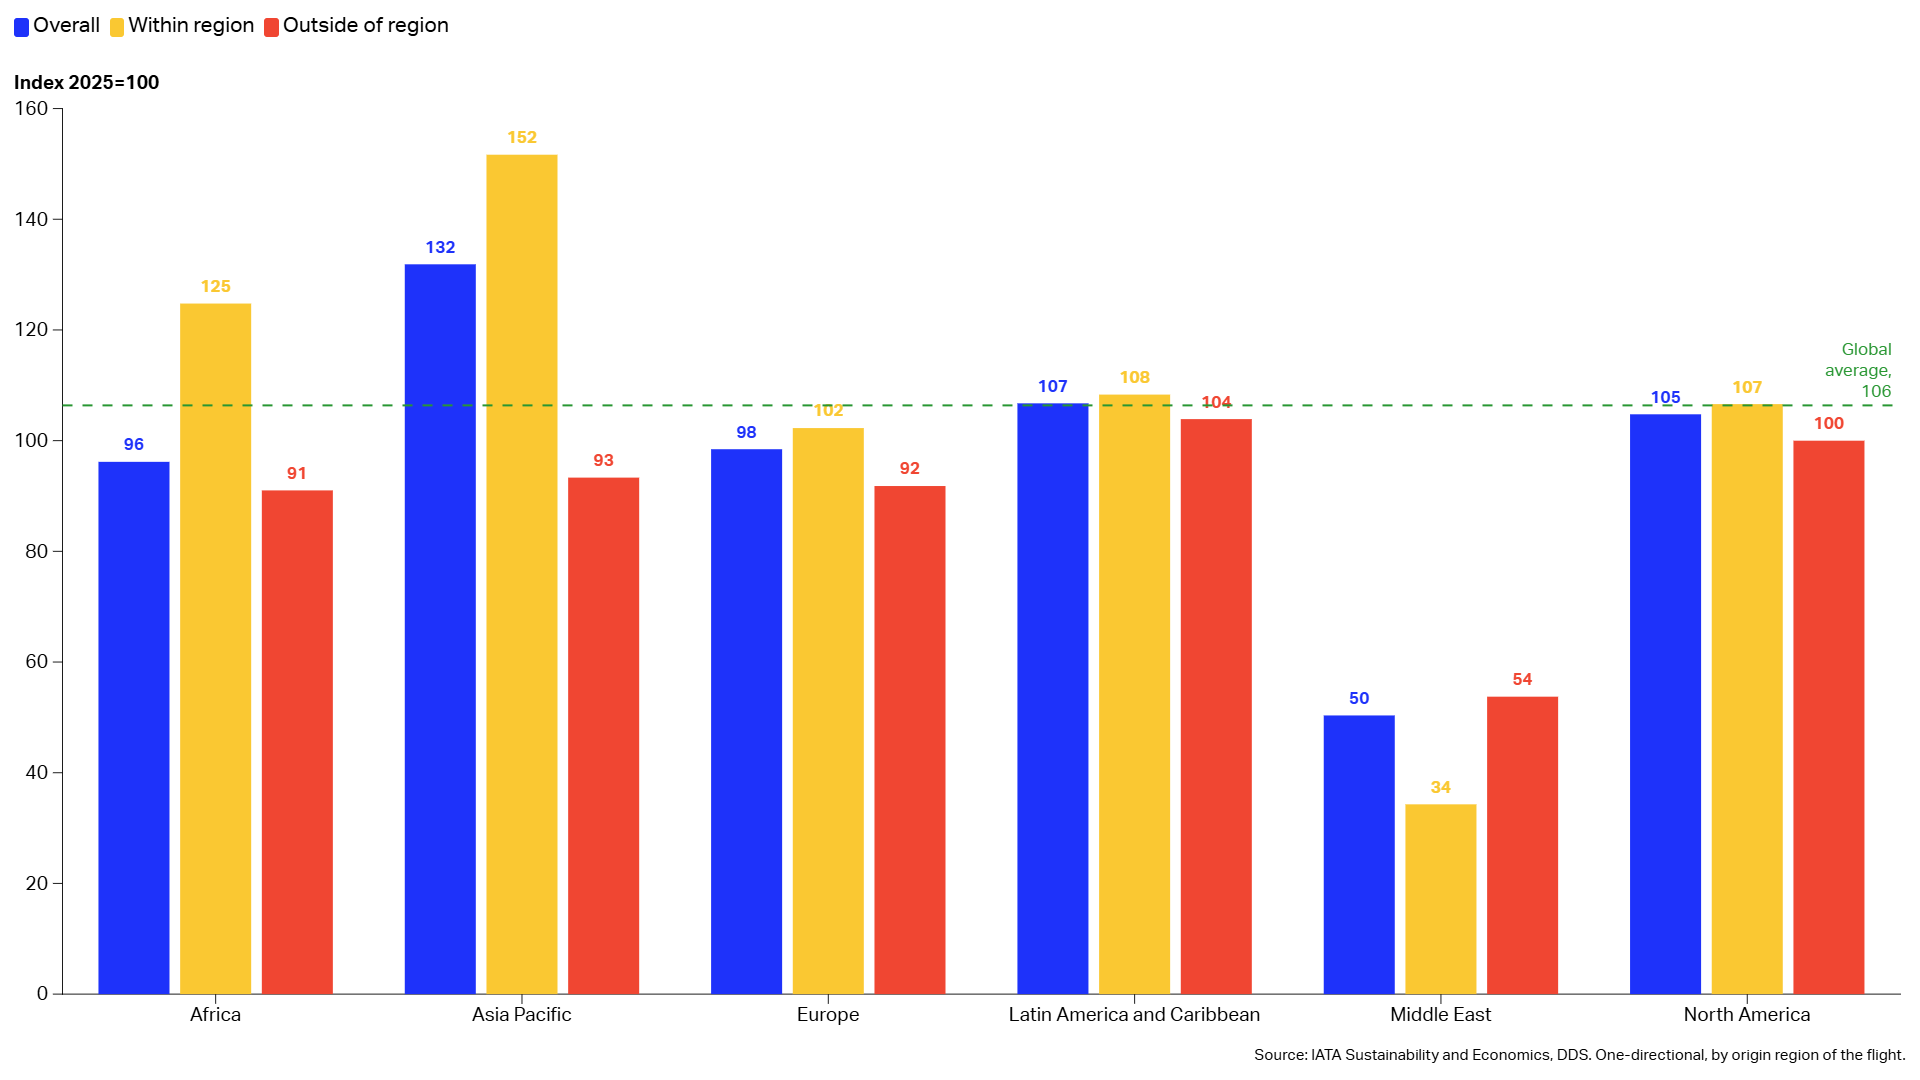
Despite the major disruption to travel caused by the war in Iran and the exceptionally high jet fuel prices, global air passenger ticket bookings rose by 6% in March and April, for travel between June and September, compared to the same months in 2025.
Airlines Rebalance Asia Pacific Traffic Amid Iran War
15 May 2026
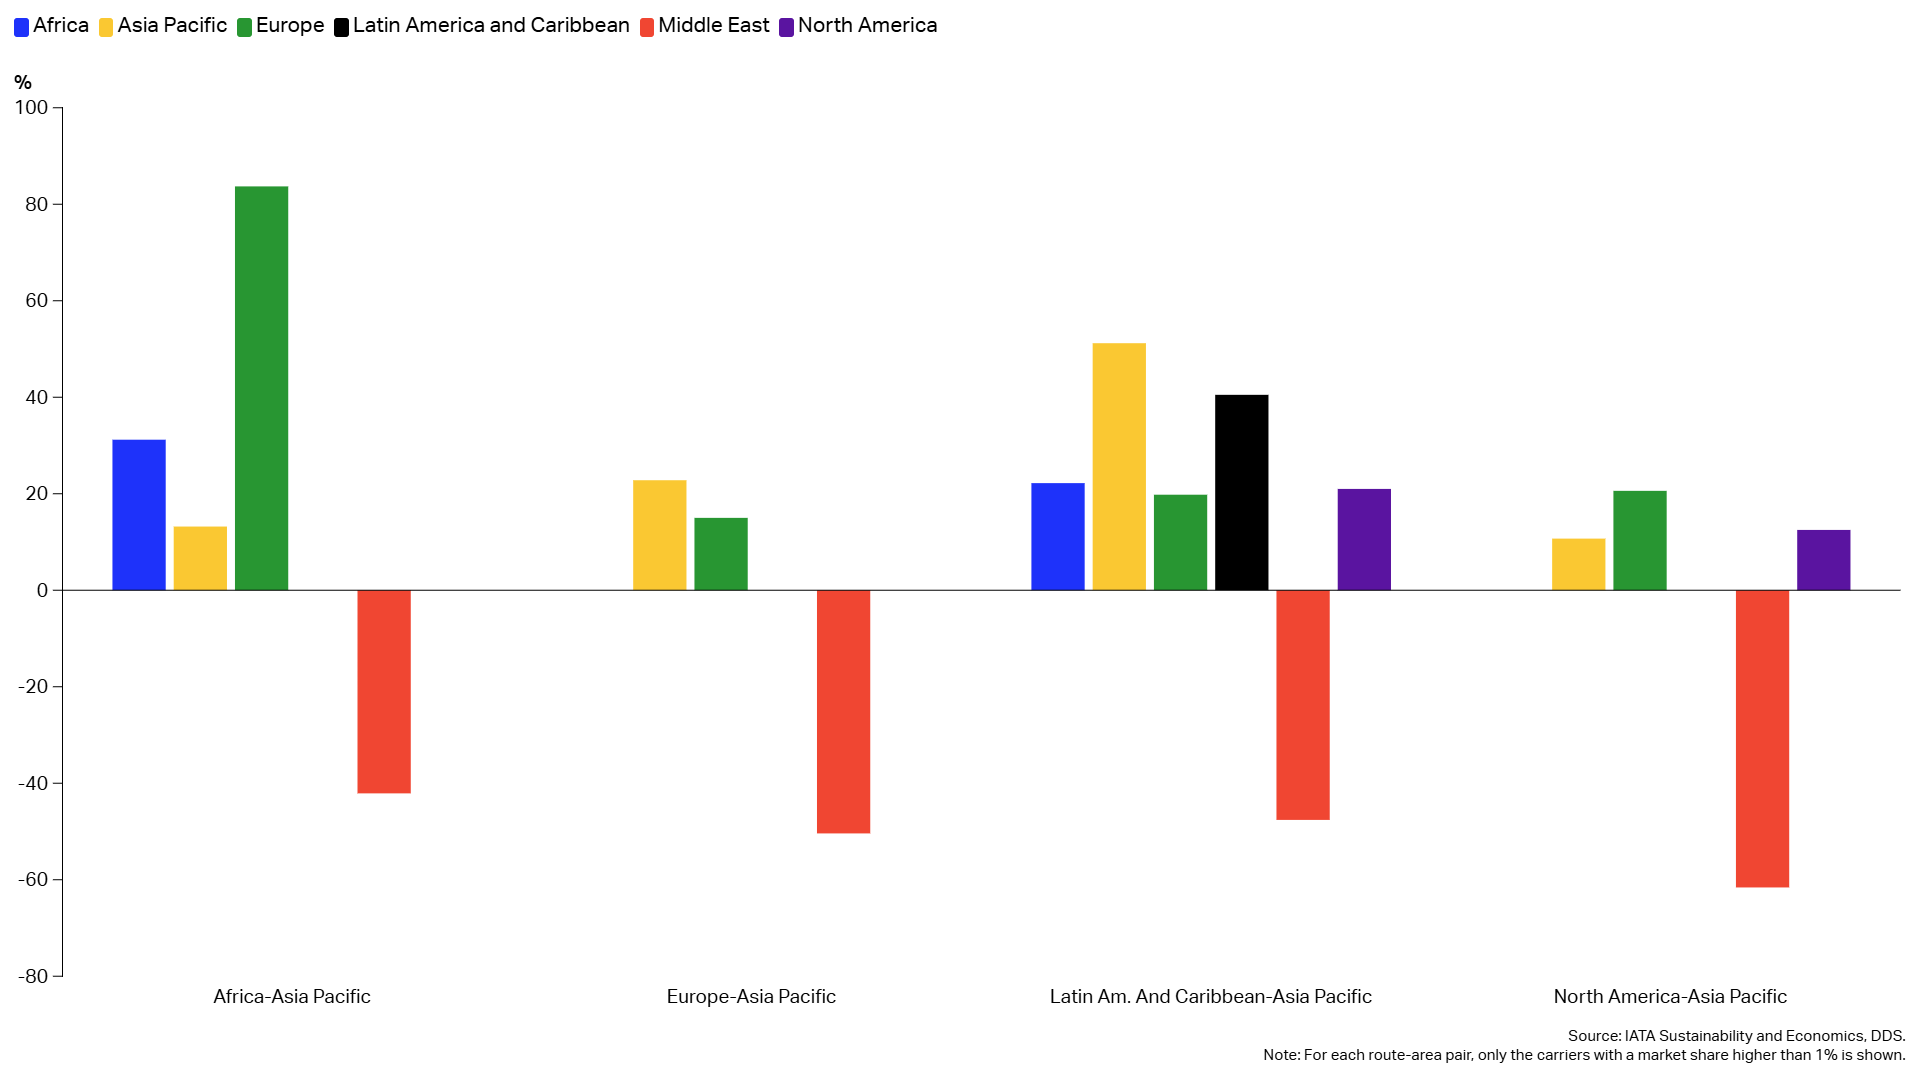
The Middle East’s geographic position makes it a major global transfer hub, shaping traffic flows across many long-haul corridors, particularly linking Asia Pacific with other regions.
The Potential of Energy Crops
8 May 2026
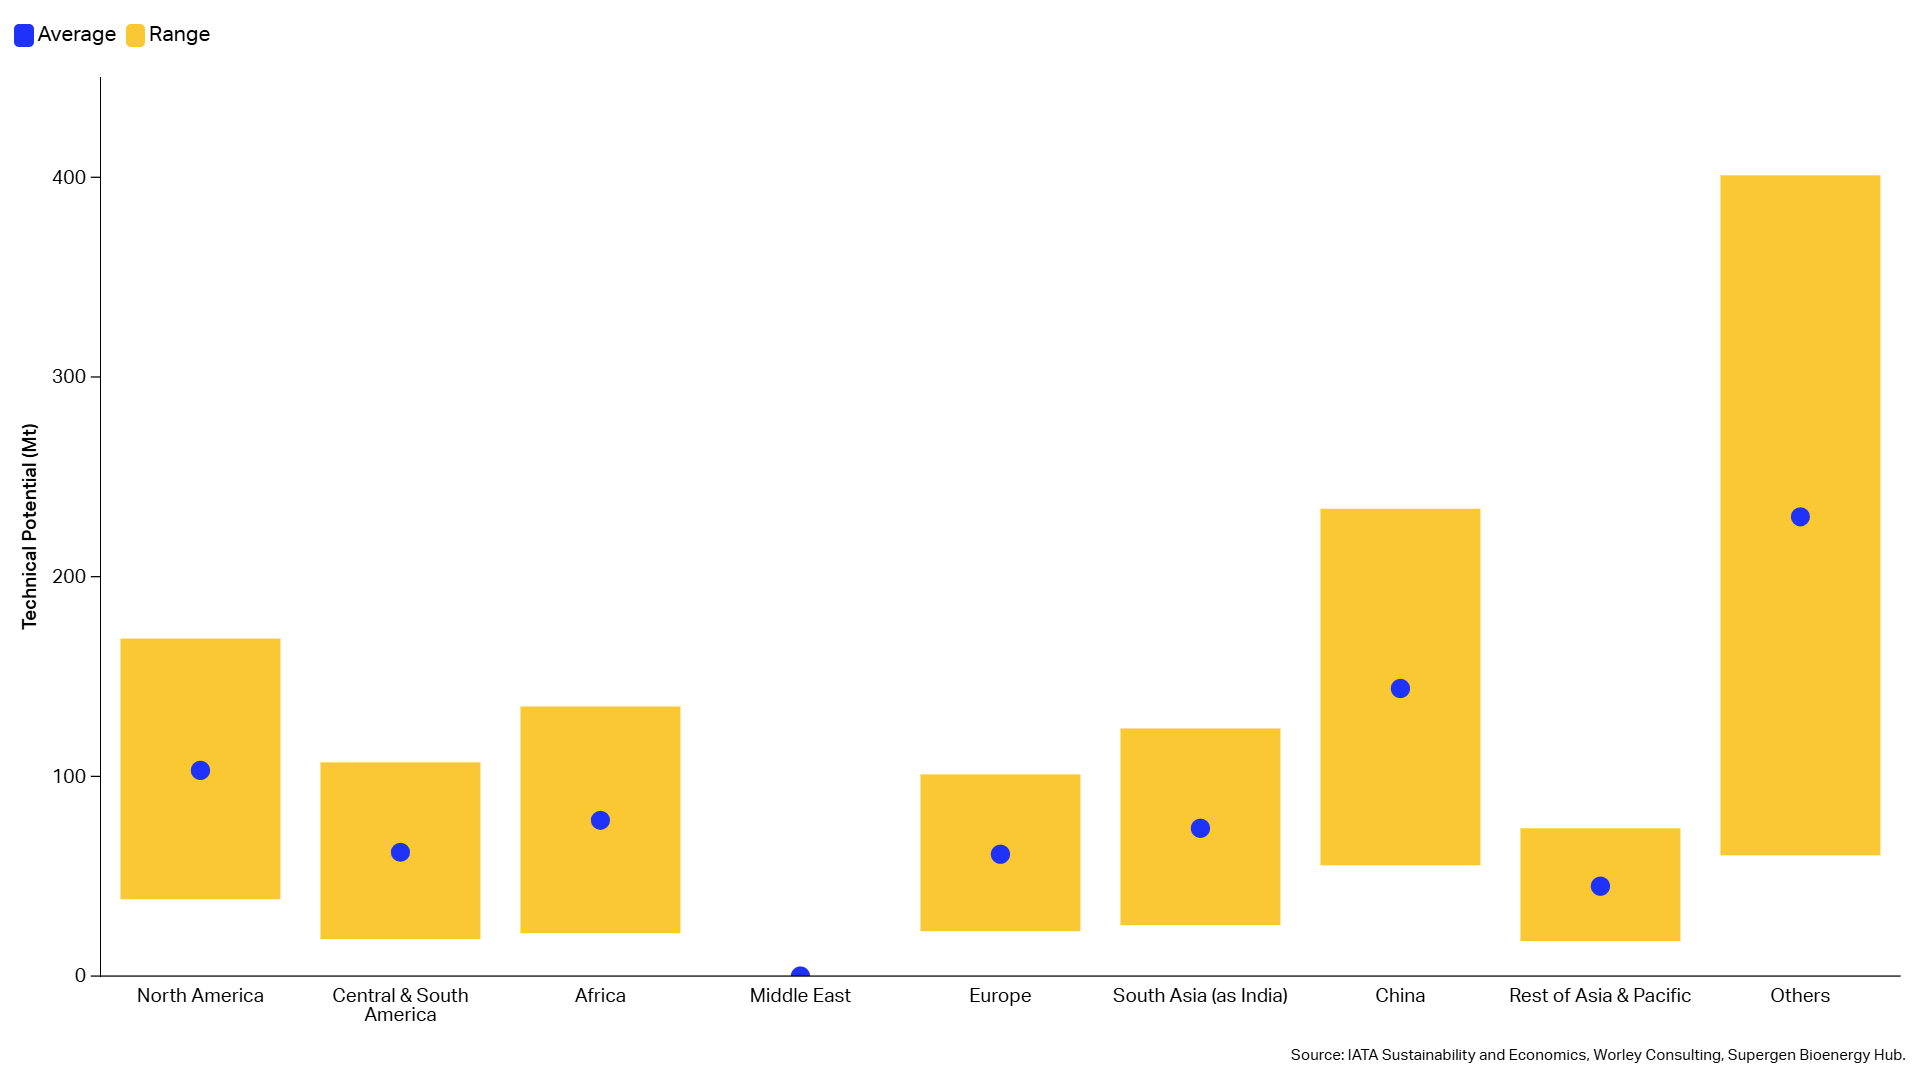
Energy crops can boost biomass availability while promoting positive environmental outcomes such as improved soil health, water quality, and biodiversity, as well as avoiding potential land-use-change issues.
Weaker Yen Boosts International Travel to Japan
1 May 2026
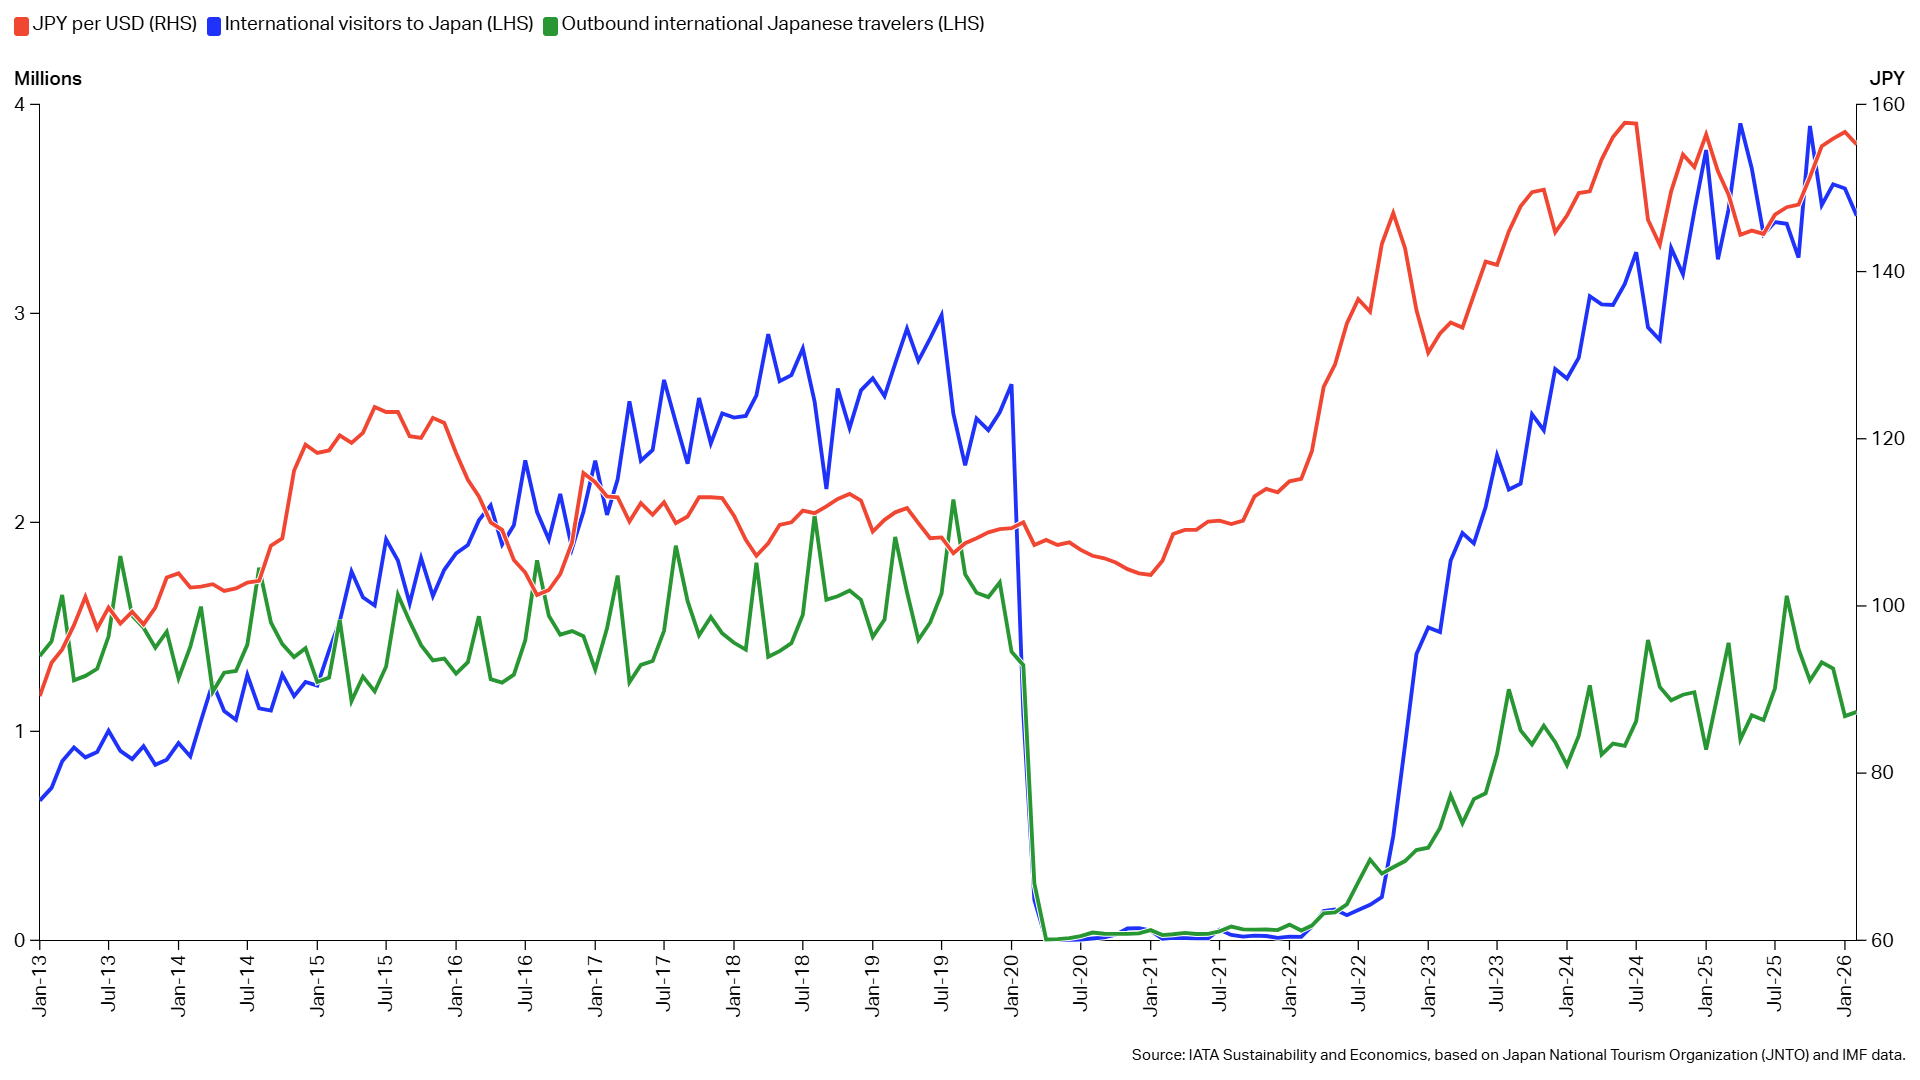
The Japanese yen (JPY) has followed a prolonged weakening trend against the US dollar (USD) since 2013.
Understanding Variability in Air Cargo Emissions Tools
24 April 2026
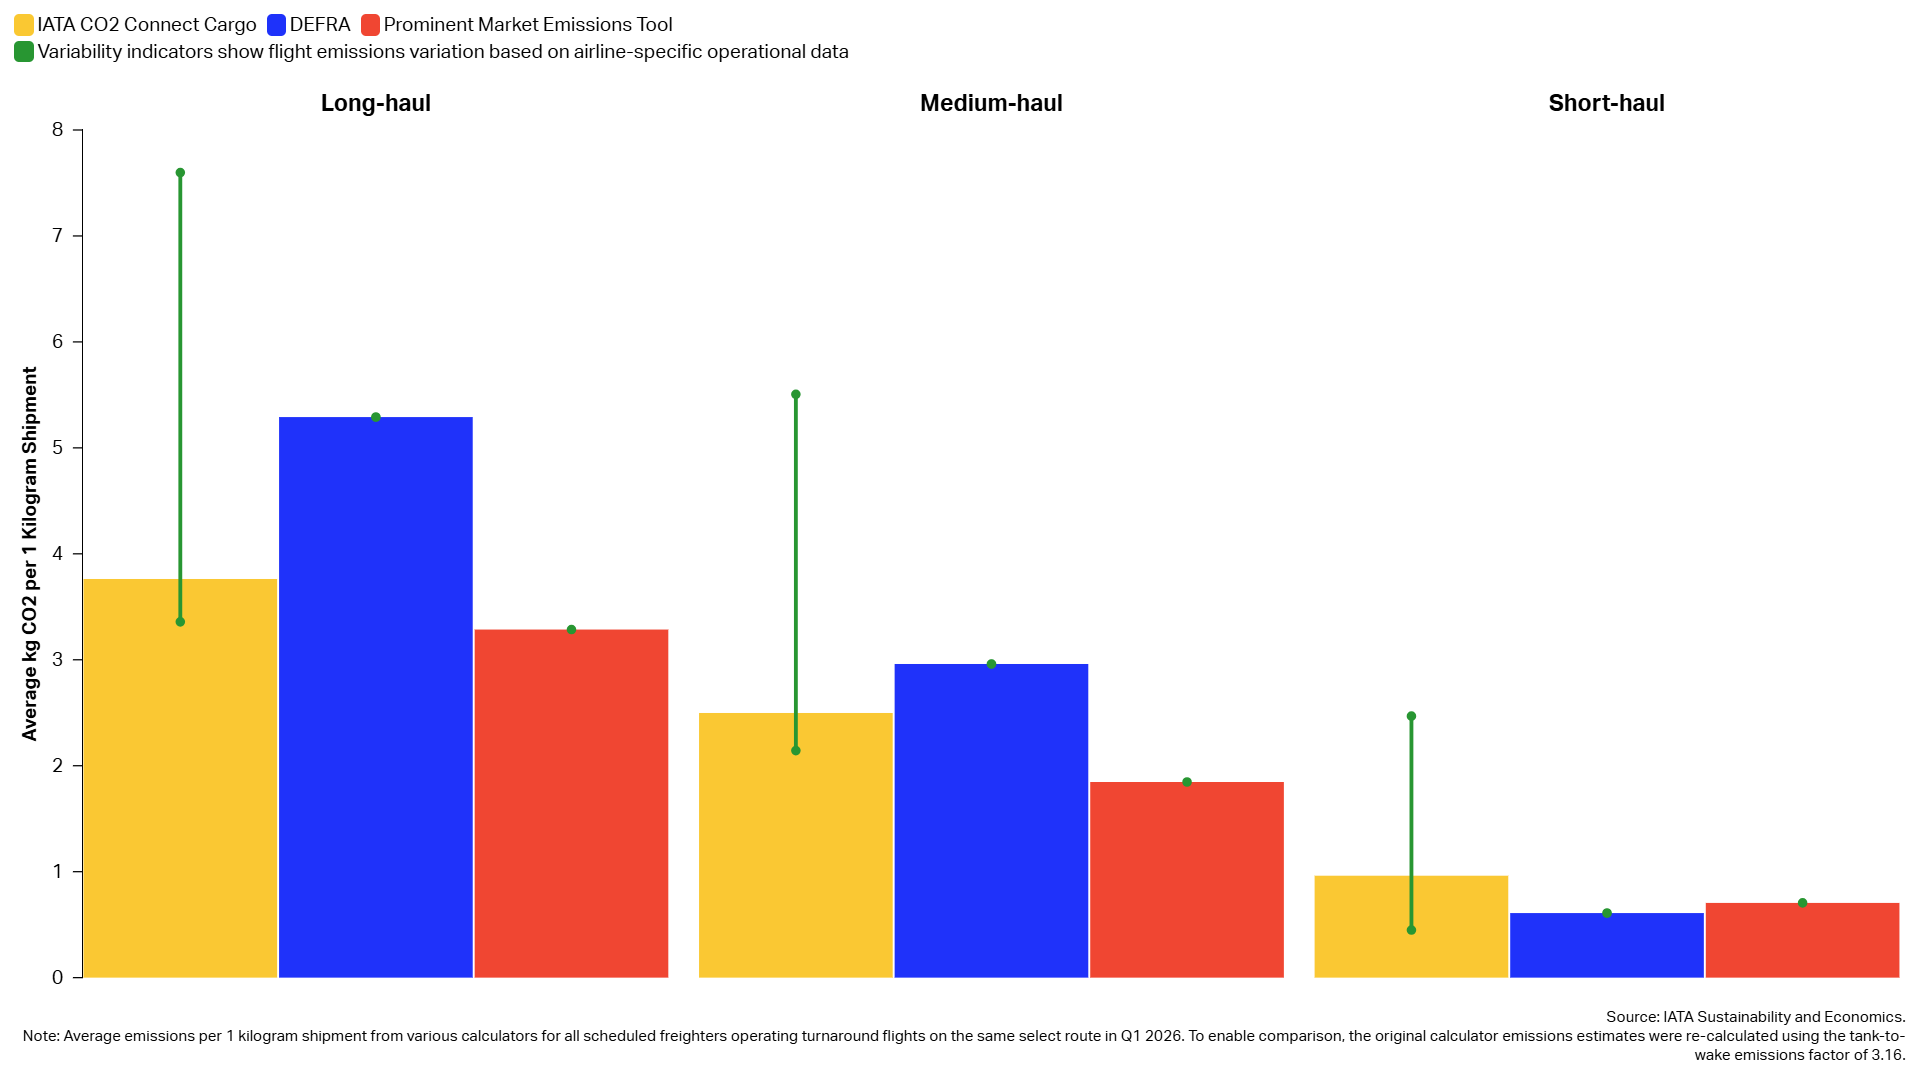
There are significant discrepancies in the flight emissions data available to shippers, depending on the emissions calculator used.
Air Cargo and US Imports: Frontloading and Beyond
17 April 2026
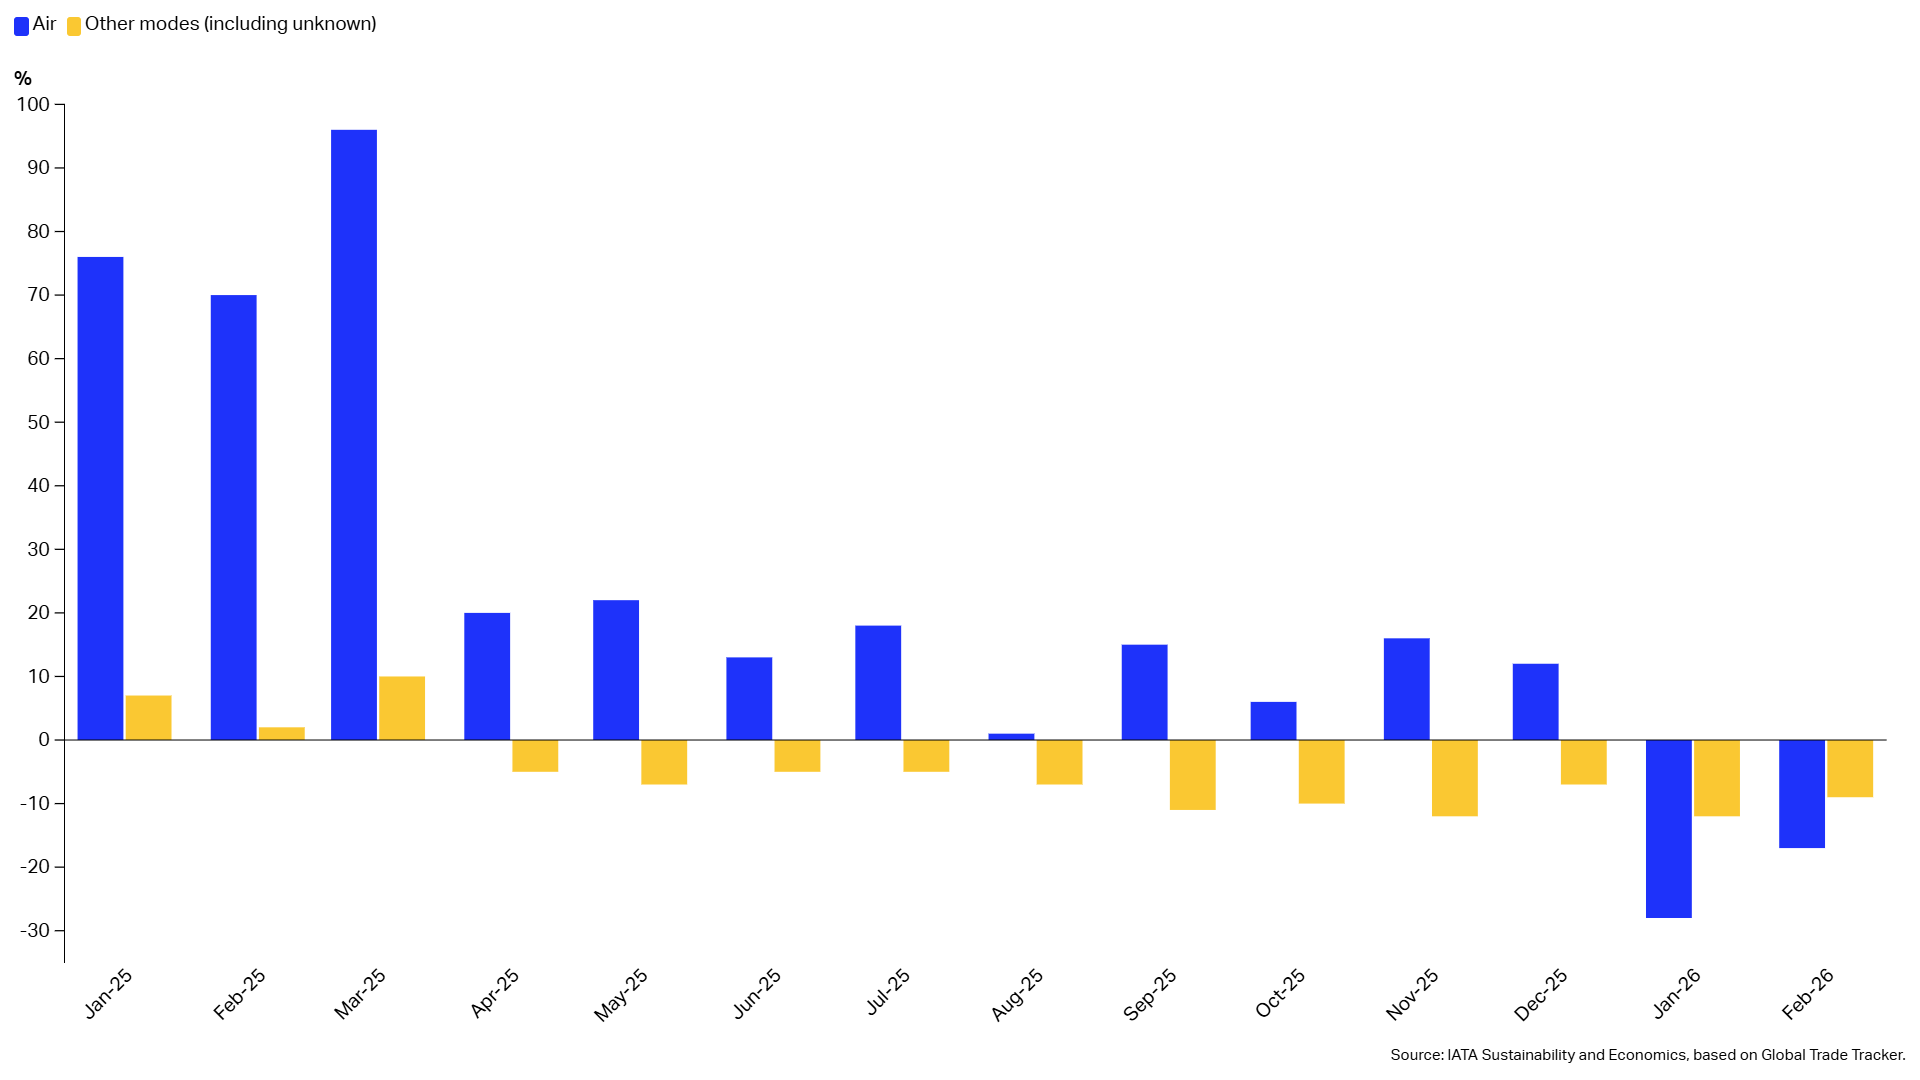
Air cargo was central to enabling frontloading in early 2025 and continues to play an important role in US imports in 2026, notably in comparison to US imports by other modes of transport.
Low-Volume Routes Most Vulnerable to Being Discontinued
10 April 2026
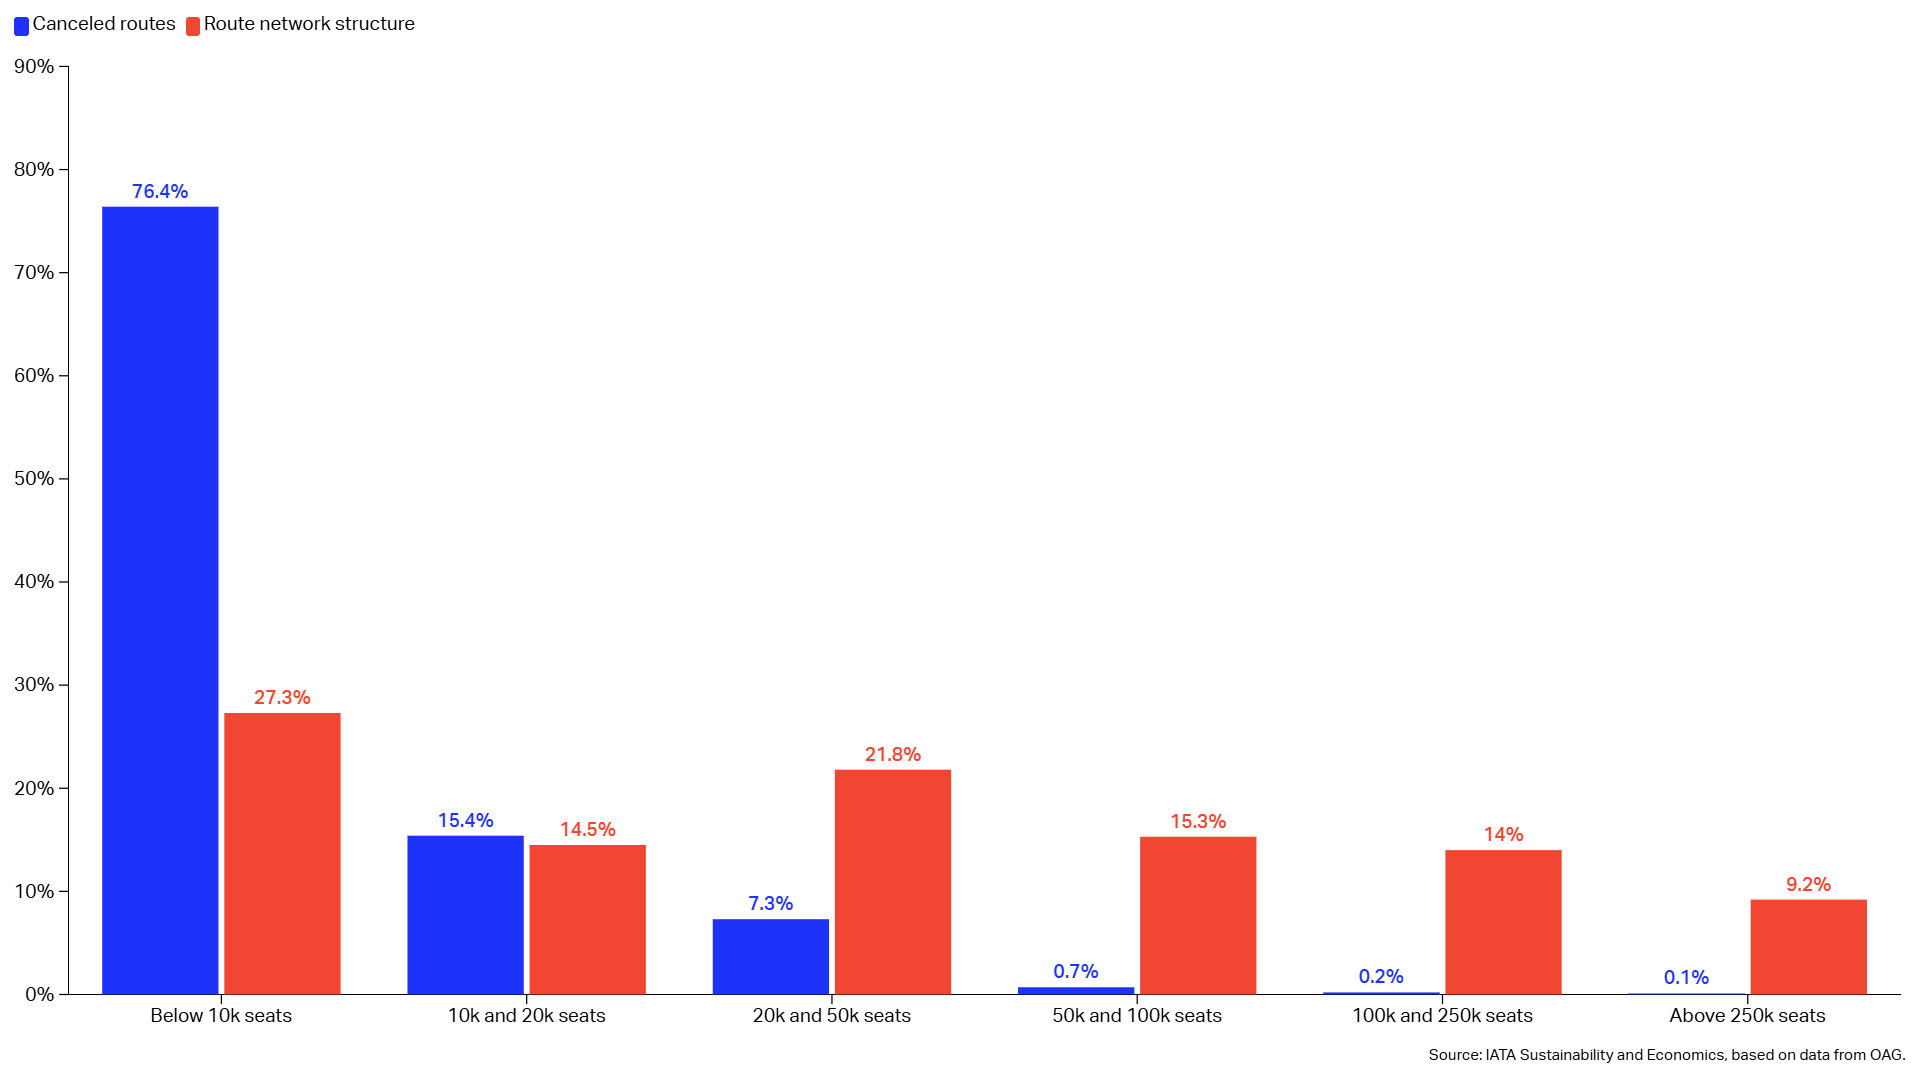
Globally, 6,500 routes operated in 2024 were discontinued in 2025. In total, routes offering less than 20,000 seats constituted 41.8% of the global network but 91.8% of all cancelations.
Loss of Within-Europe Regional Connectivity
2 April 2026
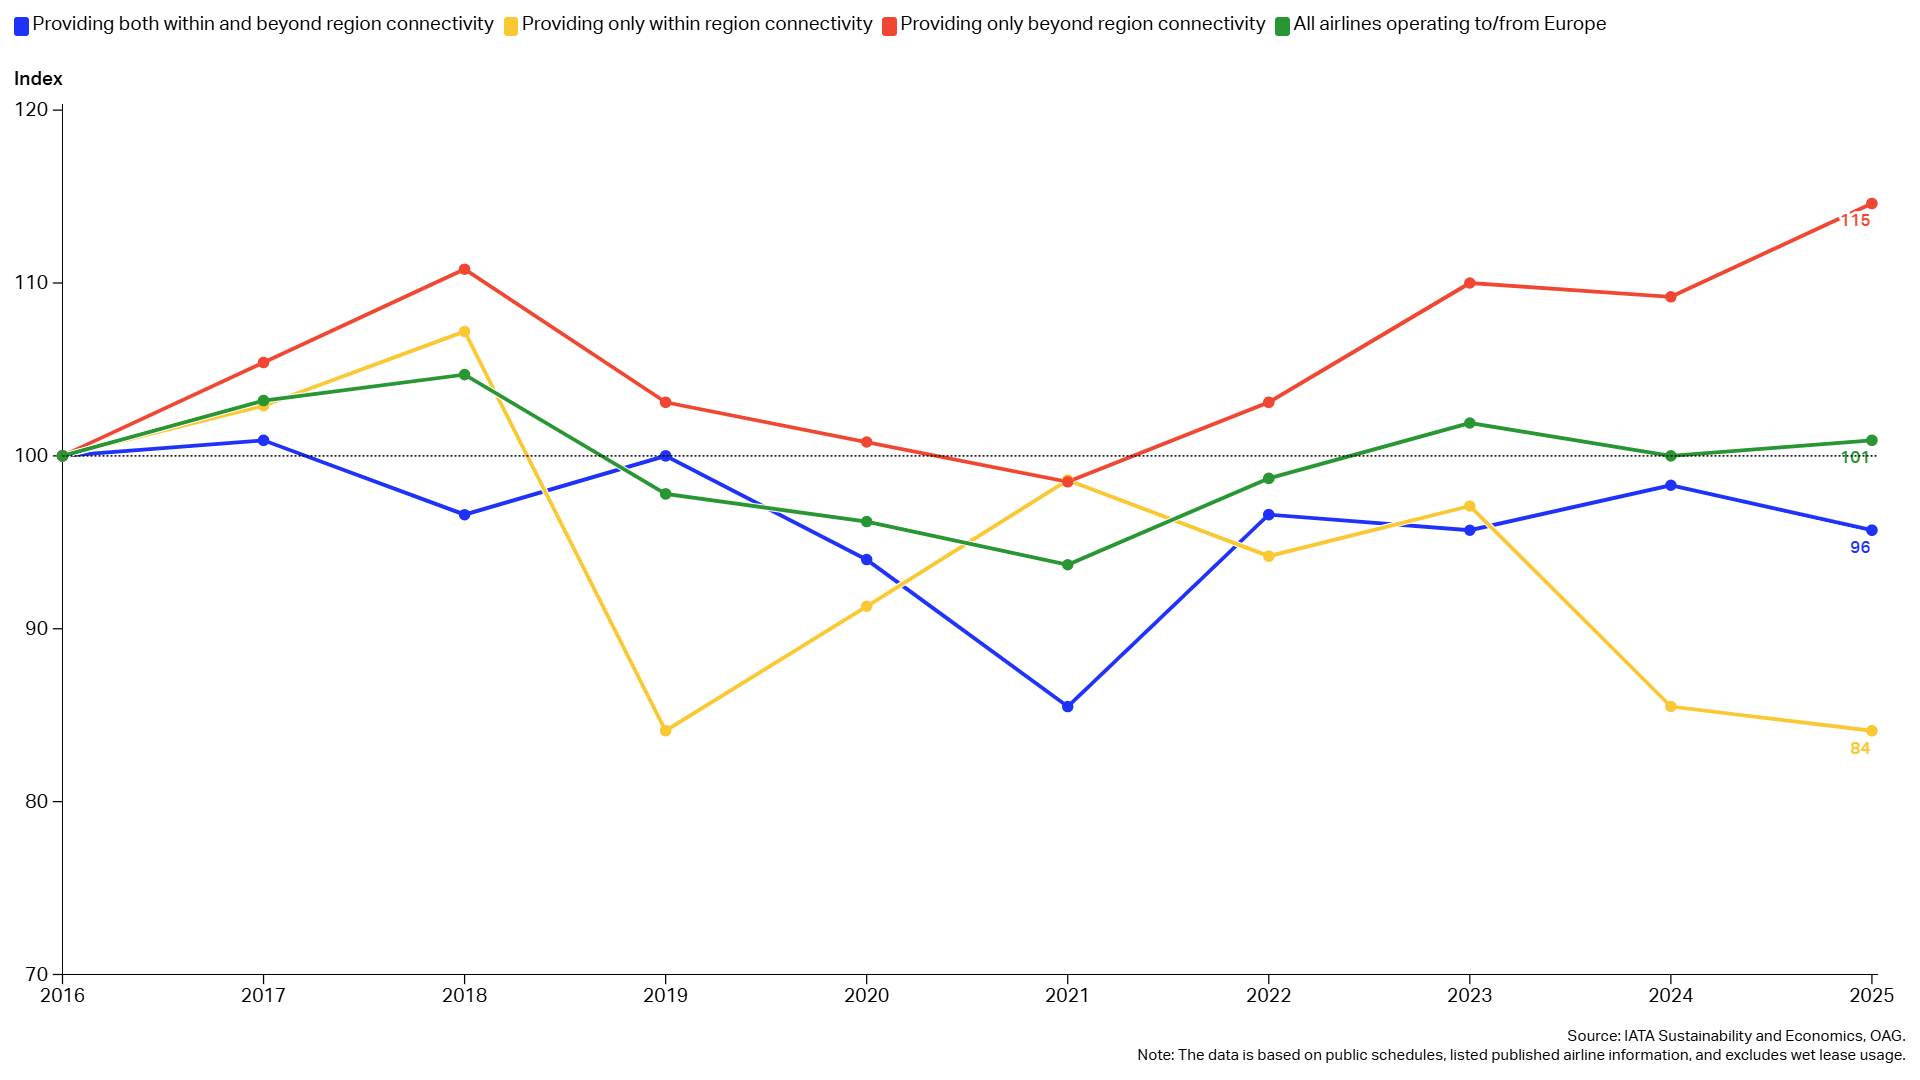
The aviation market in Europe is expanding significantly, as passenger numbers were 26% higher in 2025 than in 2016.
Global Air Traffic Disruptions in Strategic Middle East Hub
27 March 2026
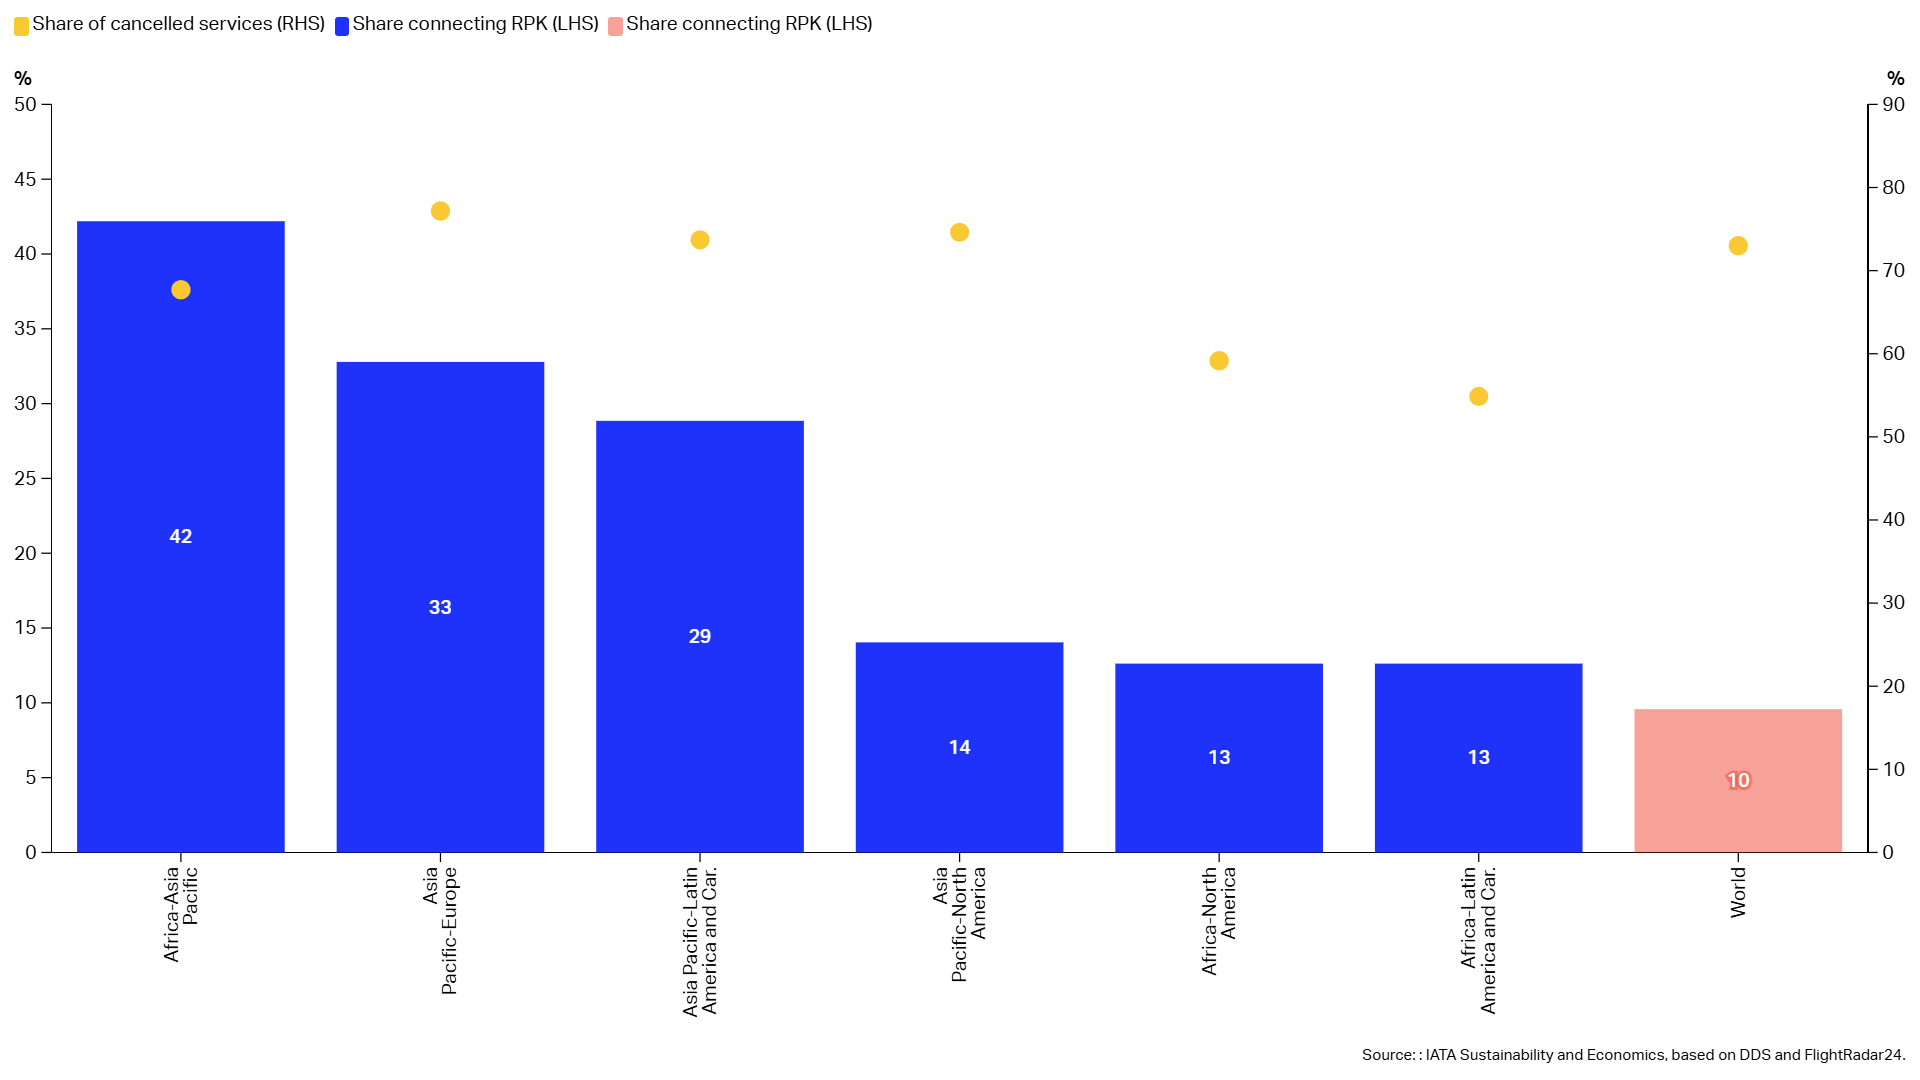
Thanks to its strategic location, the Middle East is a global transit hub for long-haul travel. 10% of all global international Revenue Passenger-Kilometers (RPK) passed through airports in the region in 2025.
The Long-Term Trends in Global GDP-RPK Growth
20 March 2026
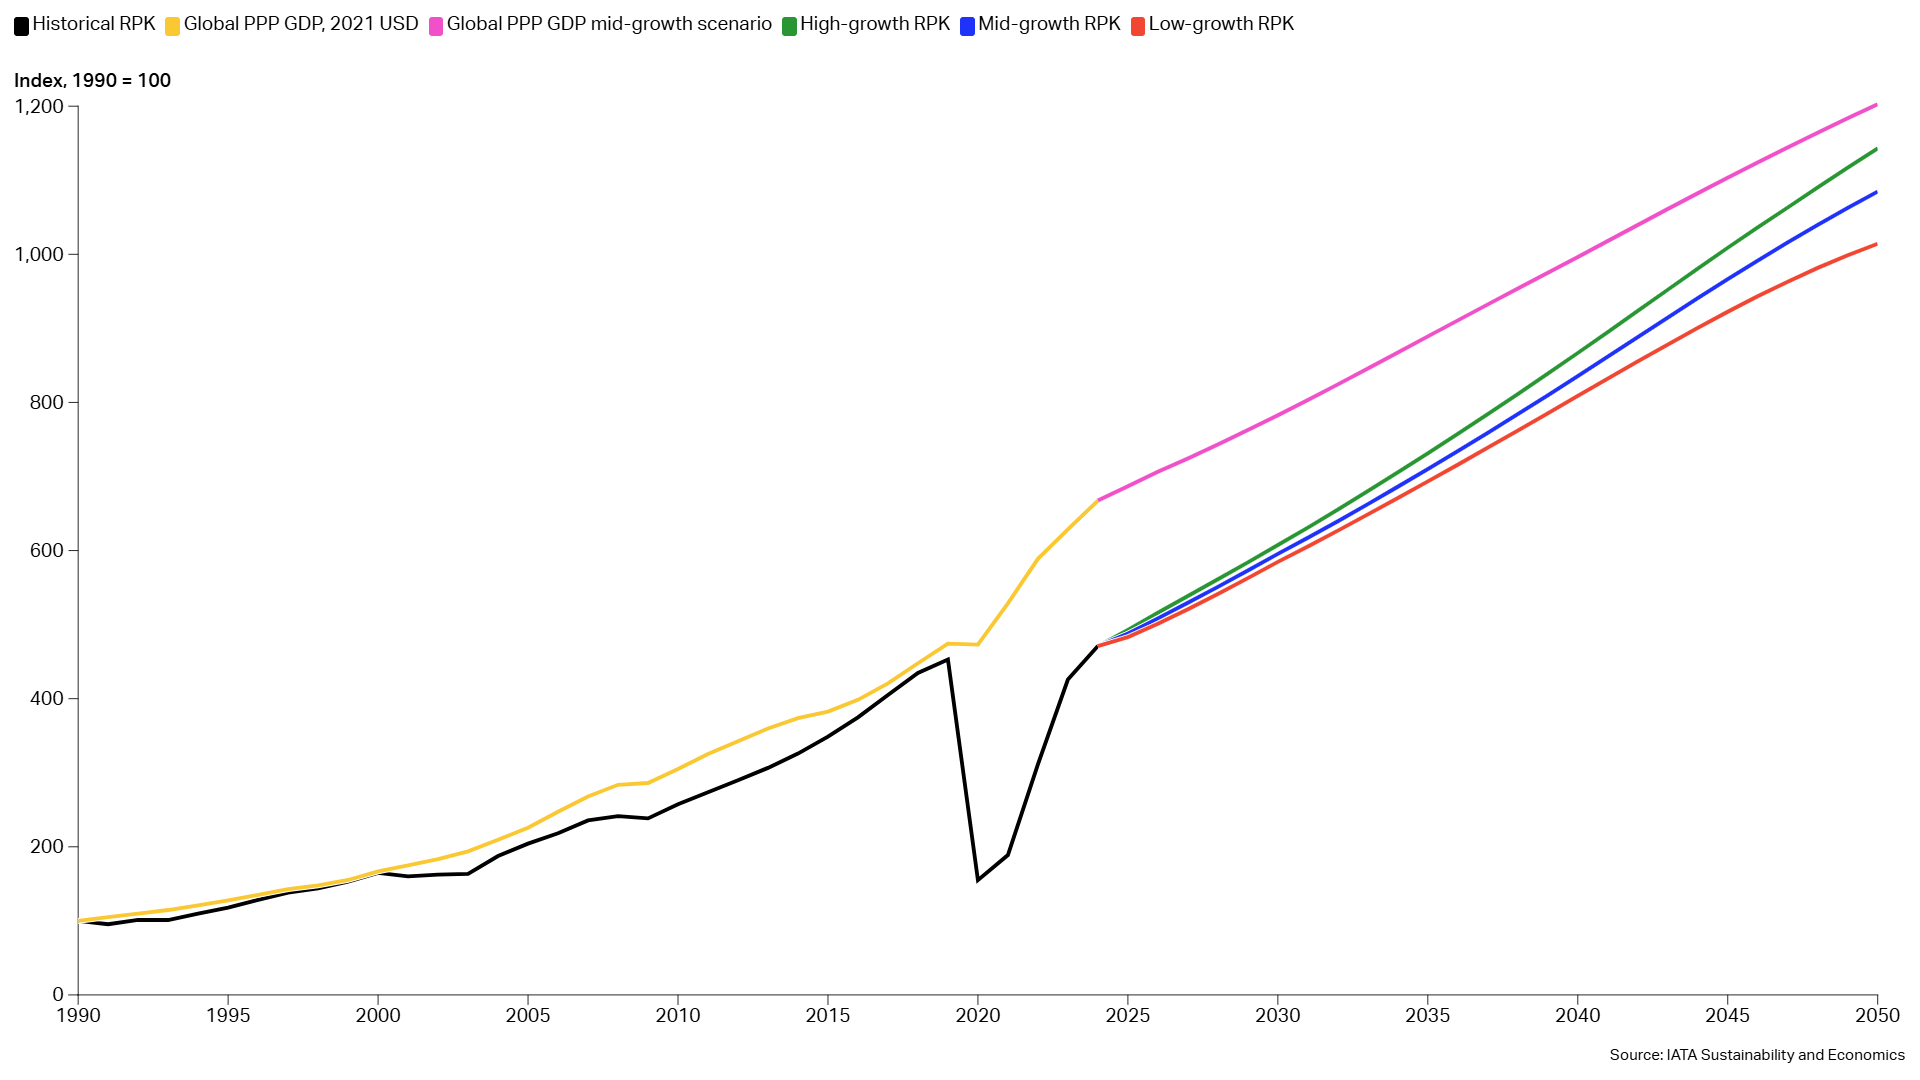
Global air travel demand, measured by Revenue Passenger Kilometers (RPKs), is expected to grow by 2.9%-3.3% per year from 2024 to 2050, according to the Long-Term Demand Projections (LTDP) published by IATA recently.
Sudden Change is More Challenging Than High Fuel Prices
13 March 2026
Jet Fuel is the highest cost for airlines (along with labor), and fluctuations in fuel prices have an important effect on the airline industry's profitability.
Middle East Conflict Exposes Jet Fuel Supply Vulnerabilities
6 March 2026
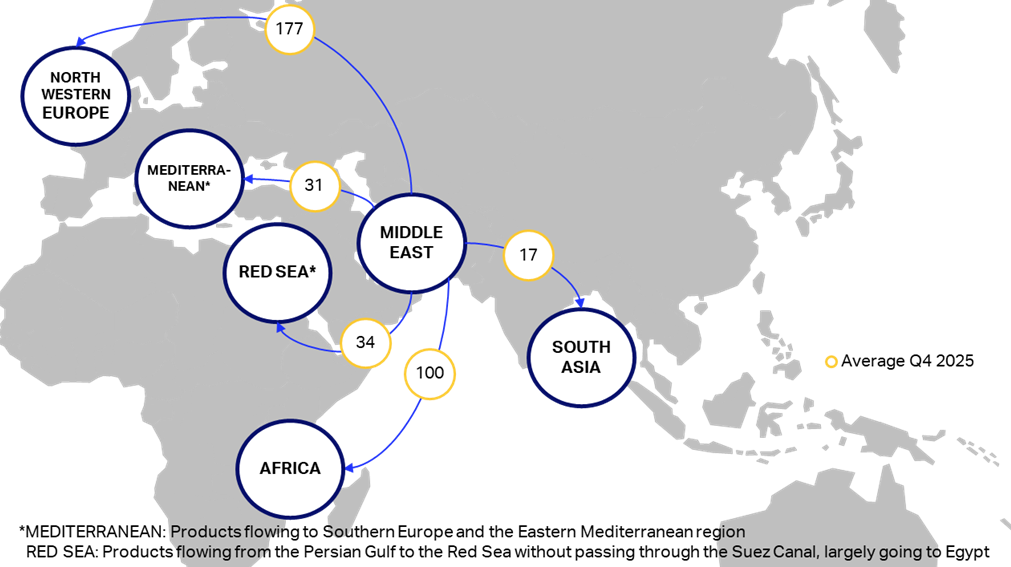
The conflict in the Middle East that escalated on 28 February 2026 has severely disrupted global energy flows, exposing deep vulnerabilities in jet fuel security.
Seasonal Demand Spike Mirrors Western Holiday Highs
27 February 2026
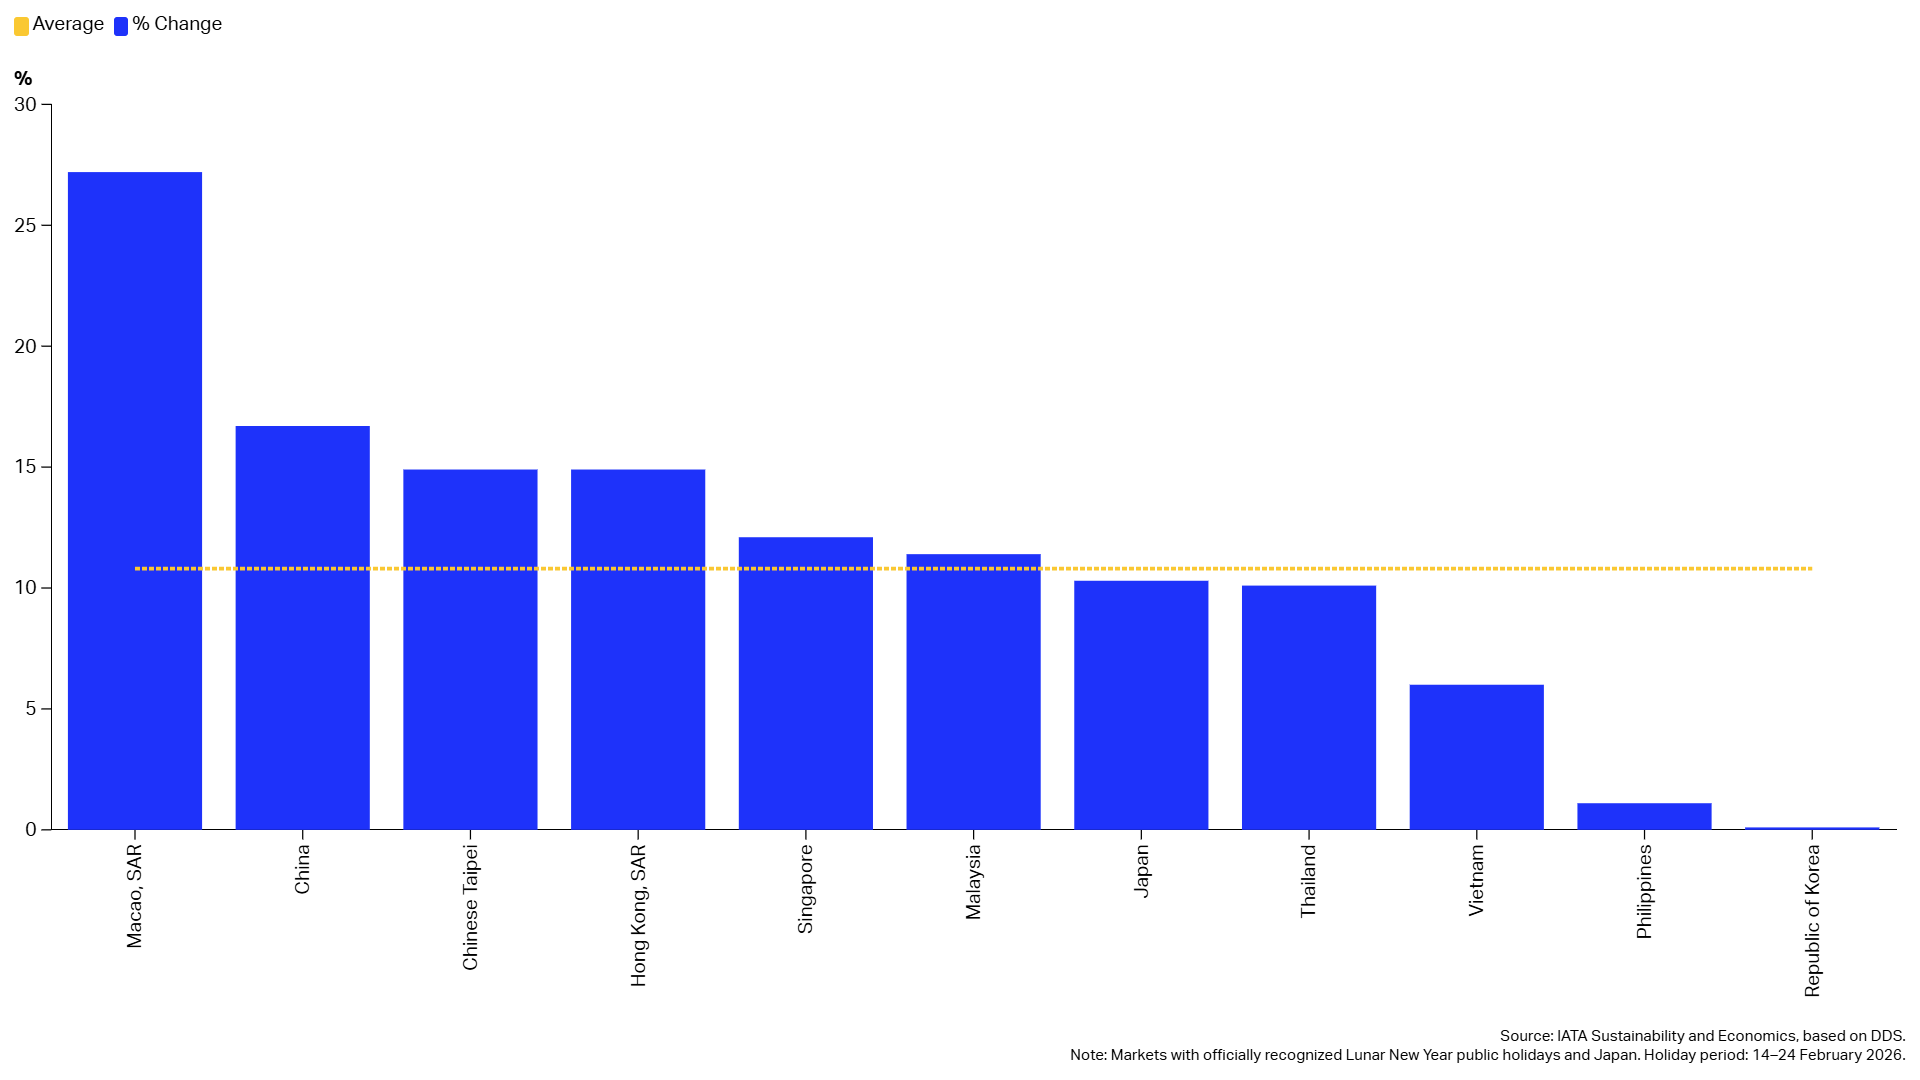
Traffic volumes during the 2026 Lunar New Year period are expected to be 10.8% higher than levels observed so far this year for a regular day, underscoring the sustained strength of seasonal demand.
Are e-SAF Projects Emerging in Cost-Competitive Locations?
20 February 2026
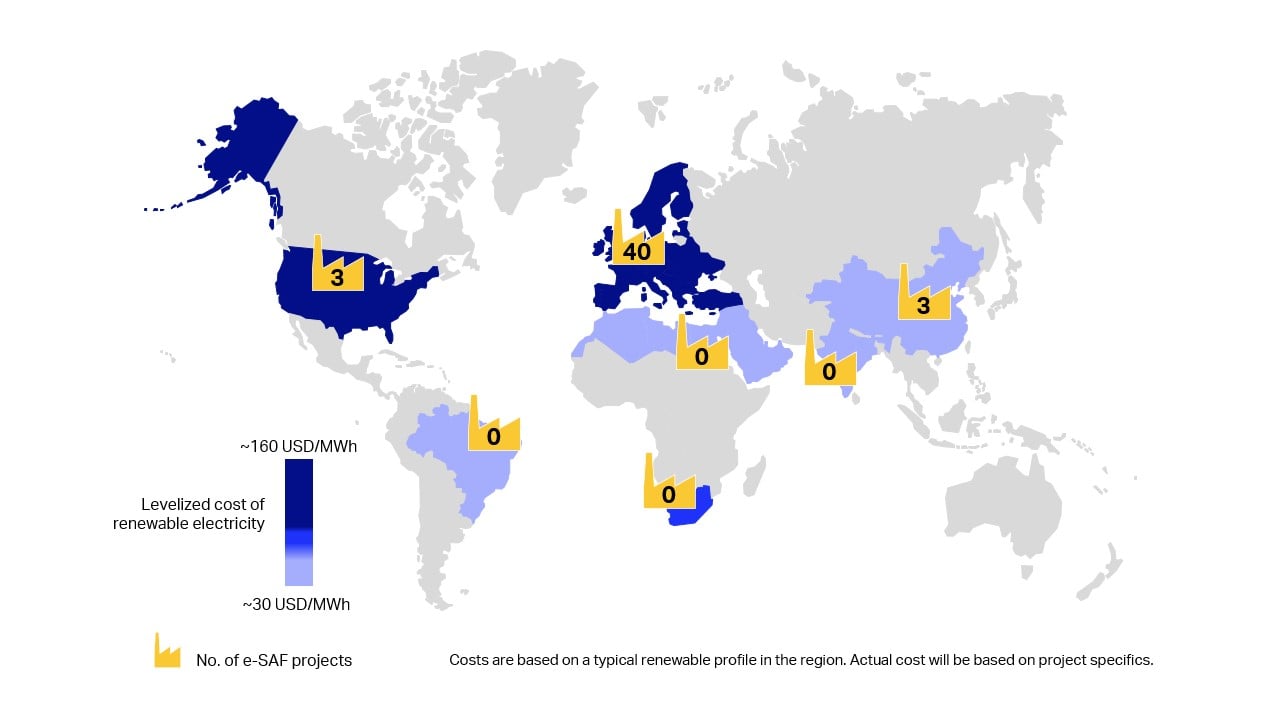
e-SAF is expected to account for over 40% of the total SAF needs by 2050. Yet, no commercial-scale eSAF facilities are currently in operation, and the risk of insufficient supply, particularly by 2030, is increasing.
Charging e-SAF Supply in 2030
13 February 2026
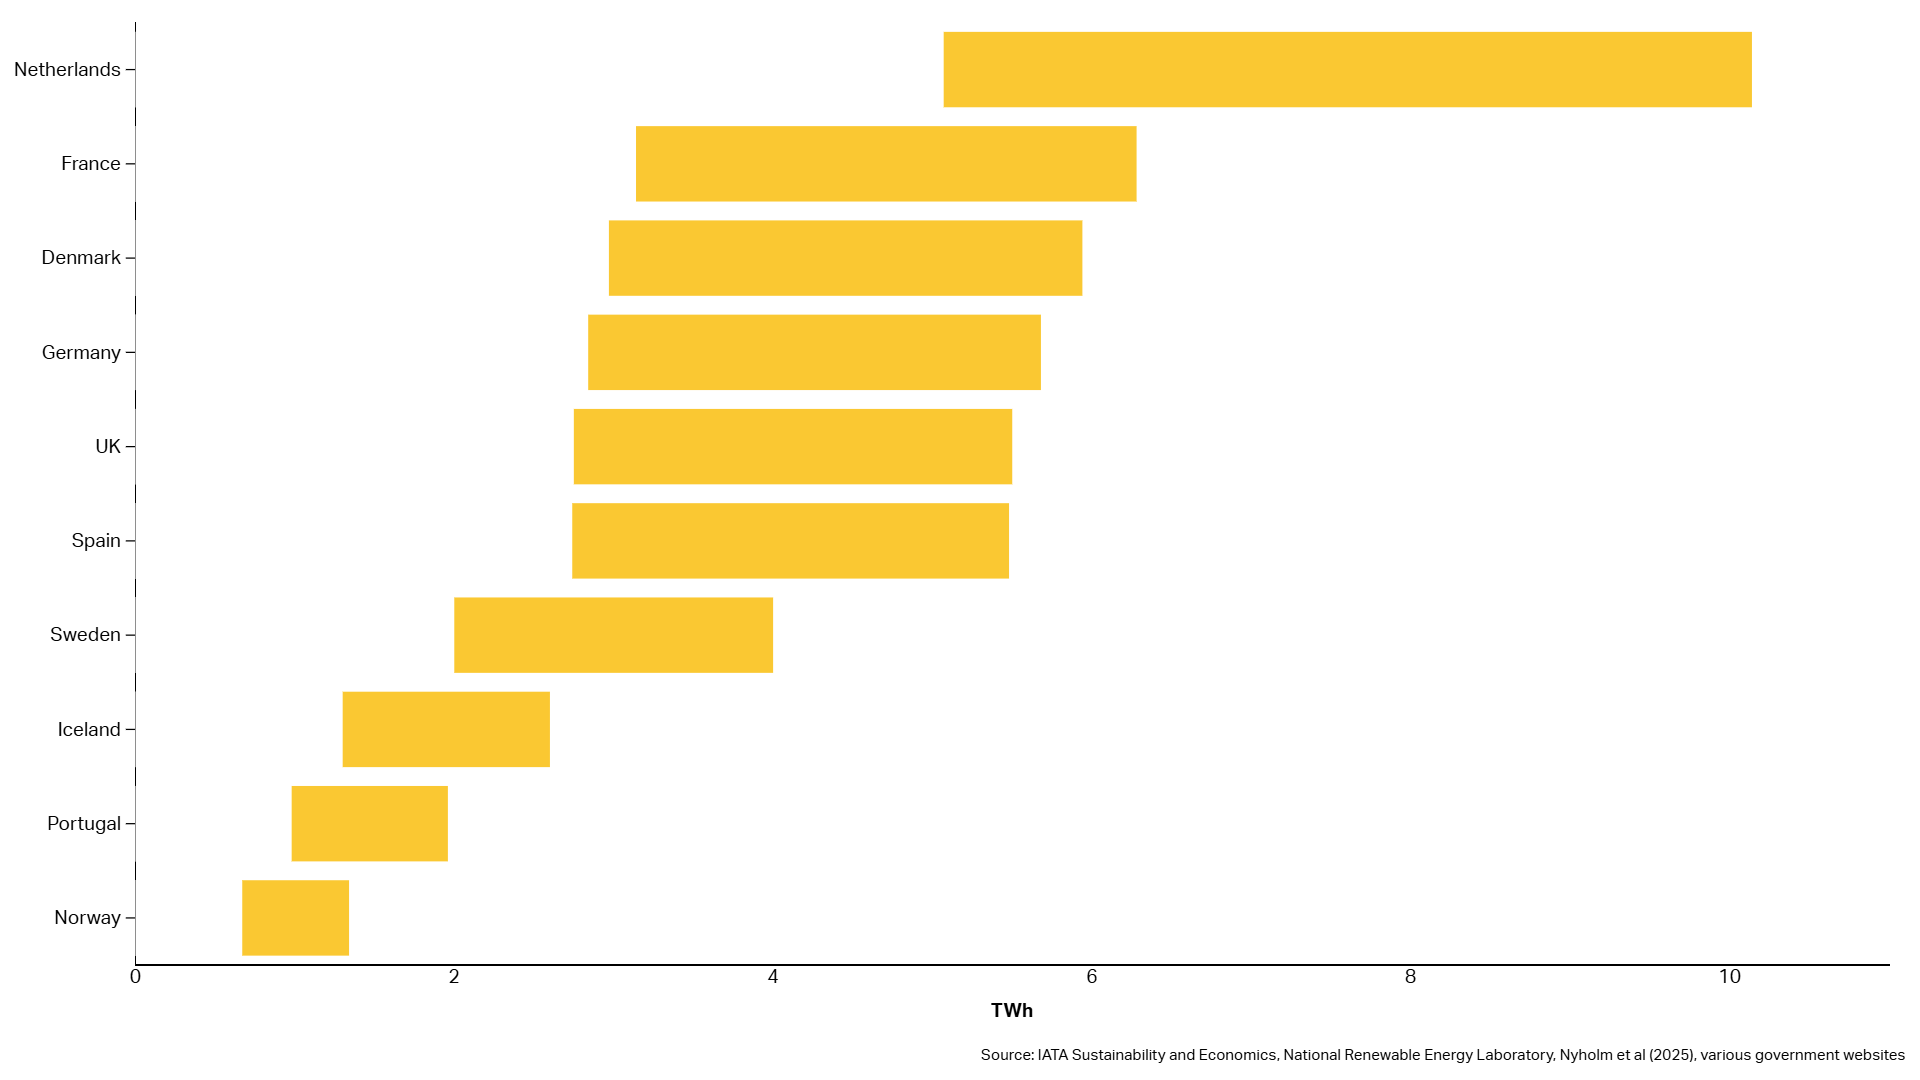
E-SAF is defined as a renewable fuel of non-biological origin and requires a significant amount of renewable electricity to produce.
Another Year With Fewer New Airlines Starting Operations
6 February 2026
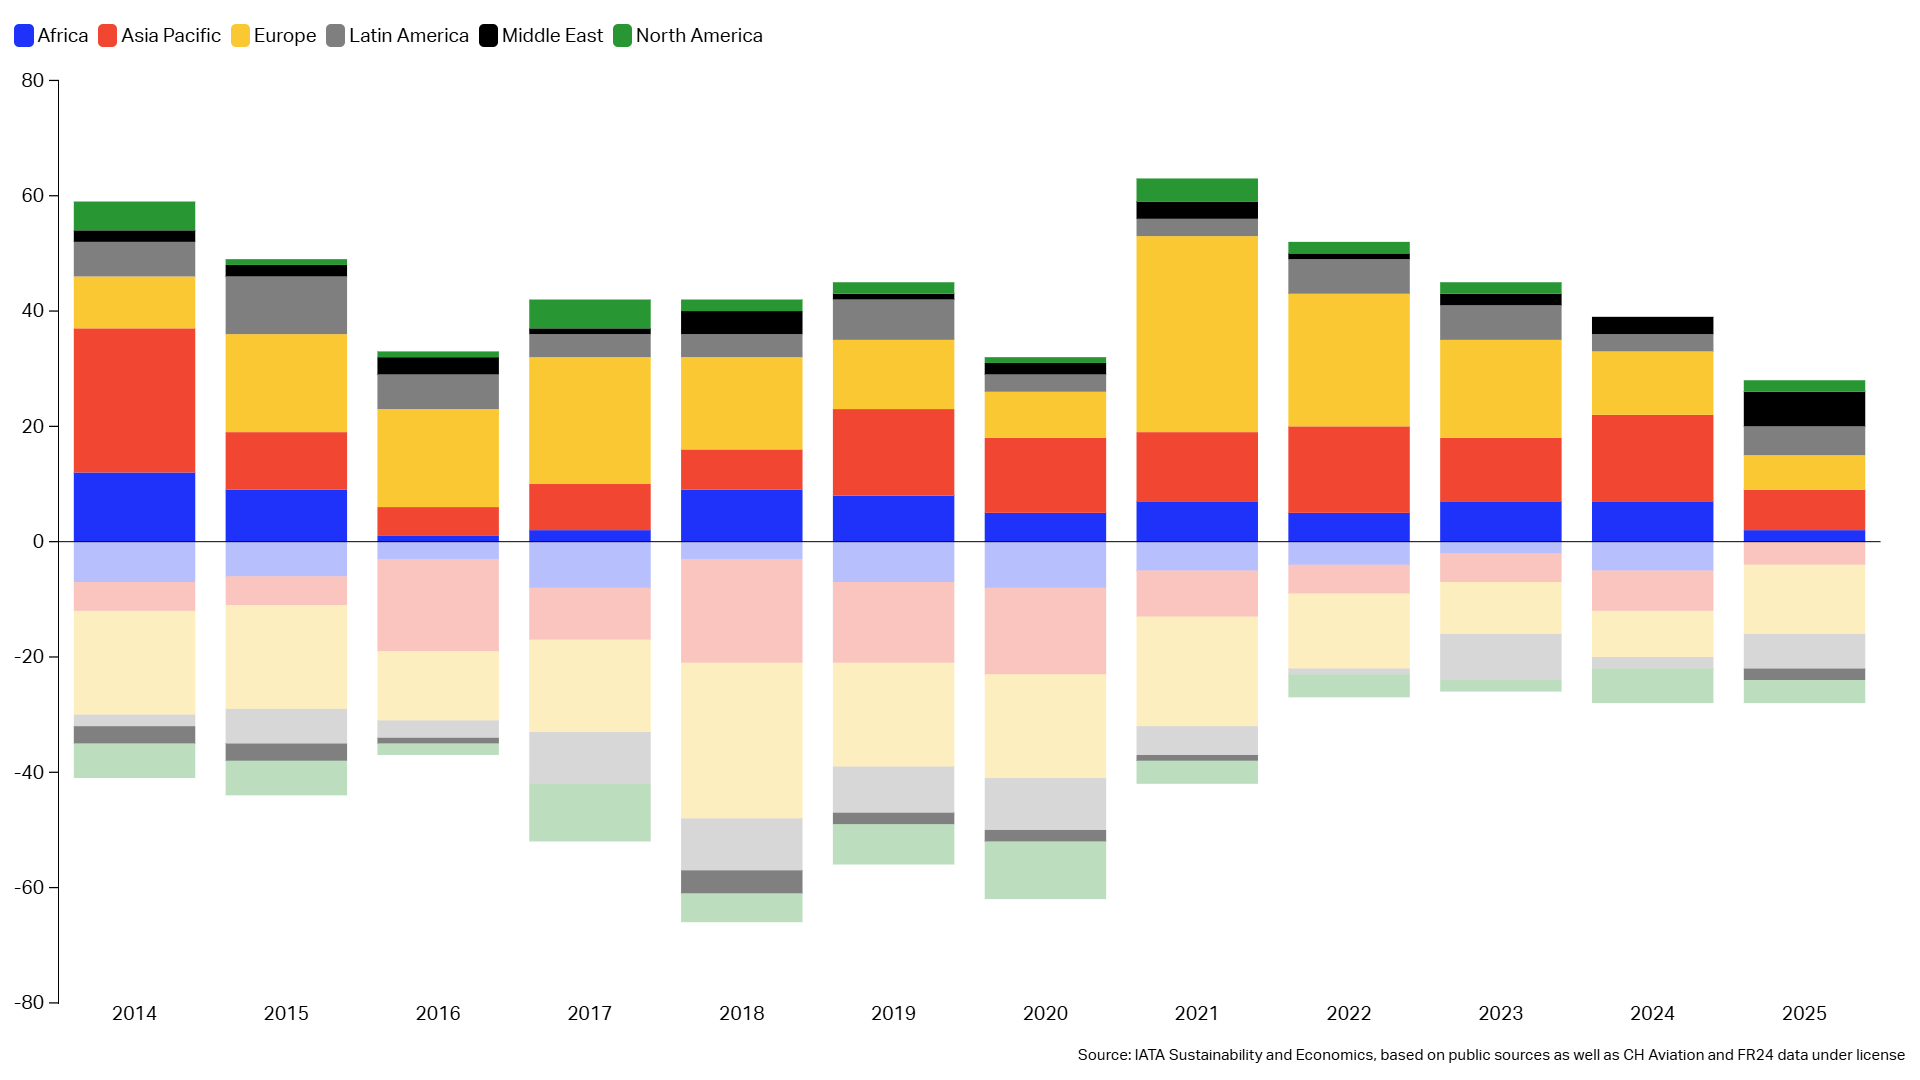
In 2025, only 28 new airlines commenced operations, marking the lowest number of market entrants since 1999.
South and East Europe Lead Growth in European Flights
30 January 2026
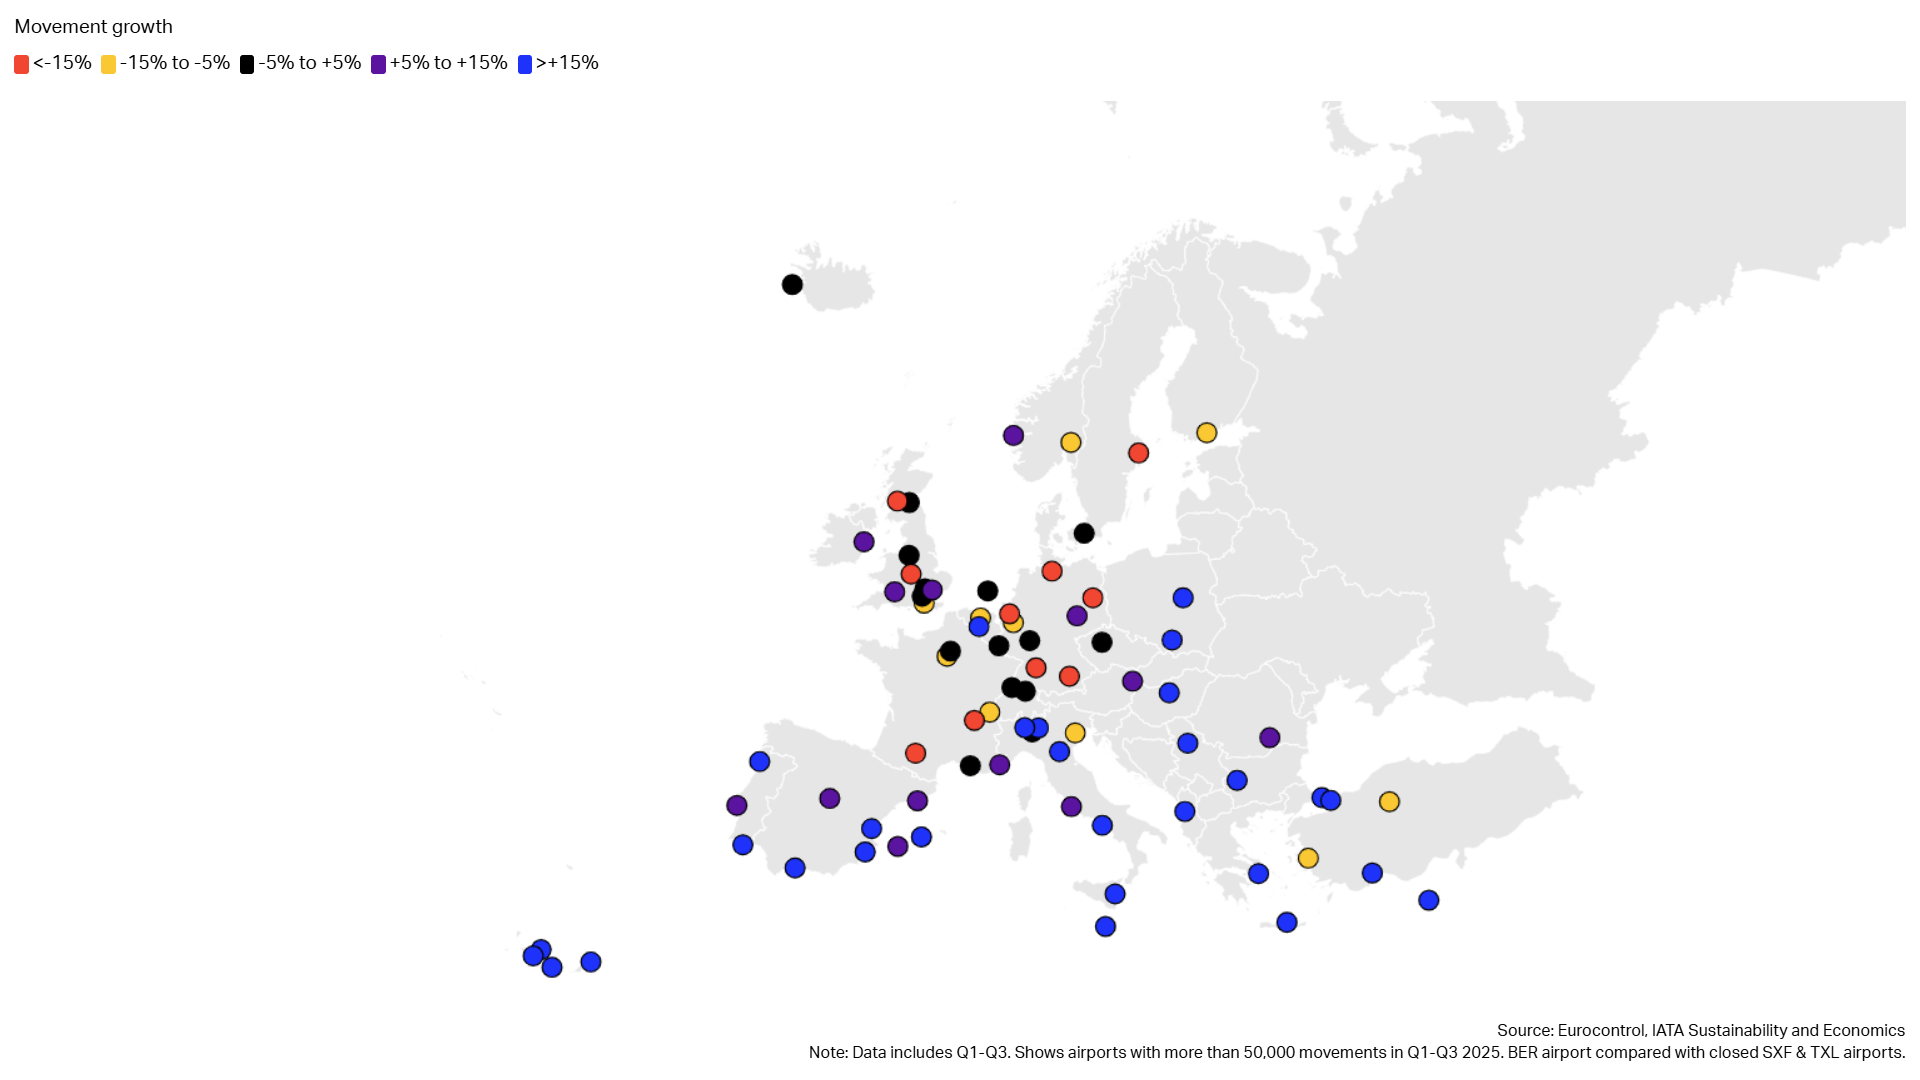
Aircraft departures and arrivals (movements) across Europe increased by 8% between 2017 and 2025.
Delays caused by European ANSPs cost EUR 17.5 billion
23 January 2026
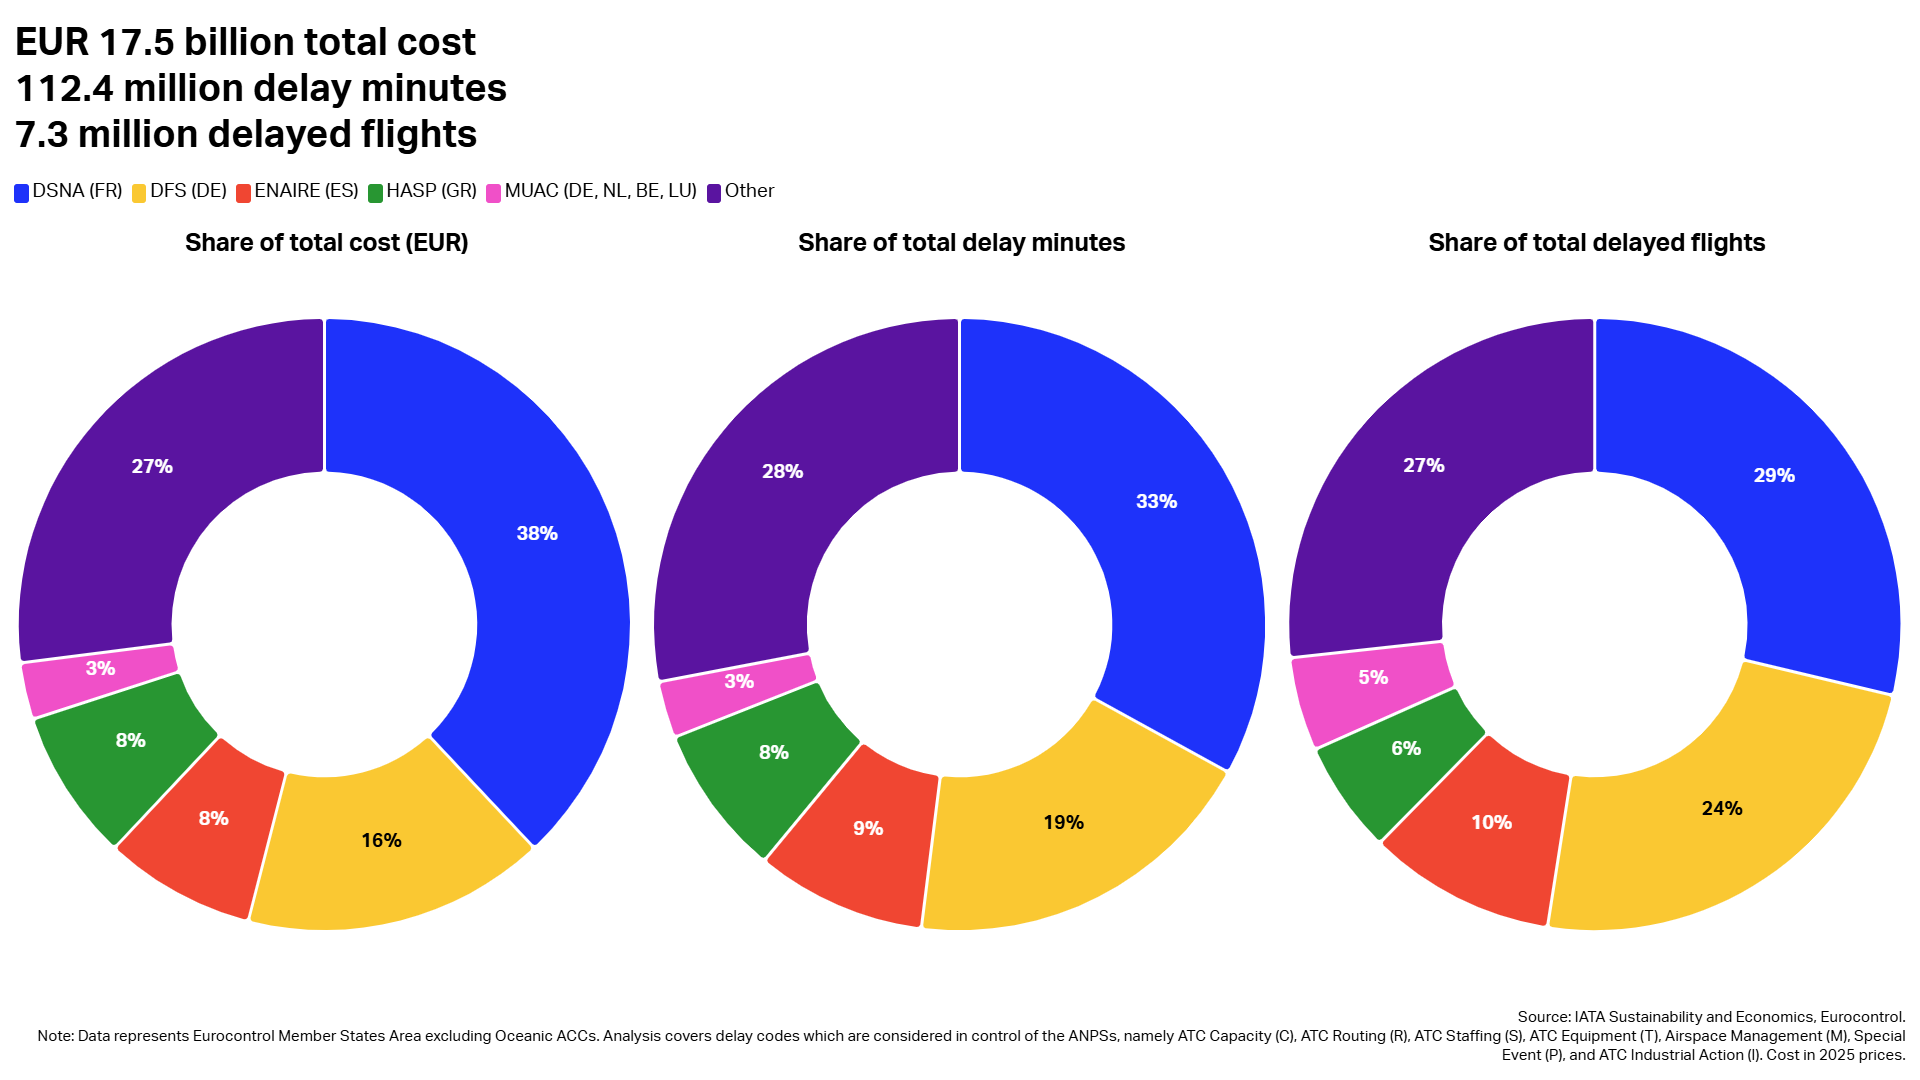
Air traffic flow management (ATFM) delays caused by European Air Navigation Providers (ANSPs) generated a cost of EUR 17.5 billion for passengers and airlines between 2015 and 2025.
A Record Festive Season for Global Air Travel
16 January 2026
Christmas and New Year are the peak periods for air travel. Millions return home to reunite with families or take advantage of the year-end holidays.