Translations
国际航协:8月份航空货运现韧性 (pdf)
Résilience du secteur du fret aérien en août (pdf)
Demanda por carga aérea mostra resiliência em agosto (pdf)
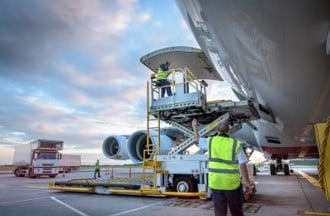
Geneva - The International Air Transport Association (IATA) released August 2022 data for global air cargo markets which demonstrated the industry’s resilience amid economic uncertainties.
Global demand, measured in cargo tonne-kilometers (CTKs*), fell 8.3% compared to August 2021 (-9.3% for international operations). This was a slight improvement on the year-on-year decline of 9.7% seen in July.
- Capacity was 6.3% above August 2021 (+6.1% for international operations). This is a significant expansion over the 3.6% year-on-year increase in July.
- Several factors should be noted in the operating environment:
- Global goods trade expanded slightly in August and the additional easing of COVID-19 restrictions in China will positively impact cargo markets. While maritime will be the main beneficiary, air cargo will also receive a boost from these developments.
- Inflation levels in G7 countries slowed for the first time since November 2020.
- Oil prices stabilized in August and the jet fuel crack spread fell from a peak in June.
- New export orders, a leading indicator of cargo demand and world trade, decreased in leading economies in all regions except the US.
“Air cargo continues to demonstrate resilience. Cargo volumes, while tracking below the exceptional performance of 2021, have been relatively stable in the face of economic uncertainties and geopolitical conflicts. Market signals remain mixed. August presented several indicators with upside potential: oil prices stabilized, inflation slowed and there was a slight expansion in goods traded globally. But the decrease in new export orders in all markets except the US tells us that developments in the months ahead will need to be watched carefully,” said Willie Walsh, IATA’s Director General.
| Air Cargo Market Detail-august 2022 | World Share1 | CTK | ACTK | CLF(%-PT)2 | CLF(LEVEL)3 |
|---|---|---|---|---|---|
| Total Market | 100% | -8.3% | 6.3% | -7.5% | 46.7% |
| Africa | 1.9% | 1.0% | -1.4% | 1.0% | 41.8% |
| Asia Pacific | 32.6% | -8.3% | 13.9% | -13.2% | 54.7% |
| Europe | 22.8% | -15.1% | 0.4% | -9.2% | 50.2% |
| Latin America | 2.2% | 9.0% | 24.3% | -5.2% | 37.4% |
| Middle East | 13.4% | -11.3% | -0.1% | -5.9% | 46.6% |
| North America | 27.2% | -3.4% | 5.7% | -3.7% | 39.3% |
1) % of industry RPKs in 2021 2) Year-on-year change in load factor 3) Load Factor Level
August Regional Performance
Asia-Pacific airlines saw their air cargo volumes decrease by 8.3% in August 2022 compared to the same month in 2021. This was an improvement over the 9.0% decline in July. Airlines in the region benefited from slightly increased levels of trade and manufacturing activity due to the easing of COVID-19 restrictions in China. Available capacity in the region increased 13.9% compared to August 2021, a significant increase over the 2.7% growth in July.
North American carriers posted a 3.4% decrease in cargo volumes in August 2022 compared to the same month in 2021. This was an improvement over the 5.7% decline in July. The lifting of restrictions in China improved demand and a further boost is expected in the coming months. Capacity was up 5.7% compared to August 2021.
European carriers saw a 15.1% decrease in cargo volumes in August 2022 compared to the same month in 2021. This was the worst performance of all regions for the fourth month in a row. This is attributable to the war in Ukraine. Labor shortages and high inflation levels, most notably in Turkey, also affected volumes. Capacity increased 0.4% in August 2022 compared to August 2021.
Middle Eastern carriers experienced an 11.3% year-on-year decrease in cargo volumes in August. Stagnant cargo volumes to/from Europe impacted the region’s performance. Capacity was down 0.1% compared to August 2021.
Latin American carriers reported an increase of 9.0% in cargo volumes in August 2022 compared to August 2021. This was the strongest performance of all regions. Airlines in this region have shown optimism by introducing new services and capacity, and in some cases investing in additional aircraft for air cargo in the coming months. Capacity in August was up 24.3% compared to the same month in 2021.
African airlines saw cargo volumes increase by 1.0% in August 2022 compared to August 2021. This was a significant improvement on growth recorded the previous month (-3.5%). Capacity was 1.4% below August 2021 levels.
> View detailed August 2022 cargo analysis (pdf)
For more information, please contact:
Corporate Communications
Tel: +41 22 770 2967
Email: corpcomms@iata.org
Notes for Editors:
- IATA (International Air Transport Association) represents some 290 airlines comprising 83% of global air traffic.
- You can follow us at https://twitter.com/iata for announcements, policy positions, and other useful industry information.
- * Please note that as of January 2020 onwards, we have clarified the terminology of the Industry and Regional series from ‘Freight’ to ‘Cargo’, the corresponding metrics being FTK (changed to ‘CTK’), AFTK (changed to ‘ACTK’), and FLF (changed to ‘CLF’), in order to reflect that the series have been consisting of Cargo (Freight plus Mail) rather than Freight only. The data series themselves have not been changed.
- Explanation of measurement terms:
- CTK: cargo tonne-kilometers measures actual cargo traffic
- ACTK: available cargo tonne-kilometers measures available total cargo capacity
- CLF: cargo load factor is % of ACTKs used
- IATA statistics cover international and domestic scheduled air cargo for IATA member and non-member airlines.
- Total cargo traffic market share by region of carriers in terms of CTK is: Asia-Pacific 32.4%, Europe 22.9%, North America 27.2%, Middle East 13.4%, Latin America 2.2%, and Africa 1.9%.