Translations:
Demanda de transporte de carga aérea teve alta de 9% em 2017, a maior desde 2010 (pdf)
La demanda de carga aérea sube 9% en 2017, el mayor crecimiento desde 2010 (pdf)
Le trafic de fret en hausse de 9 % en 2017, la plus forte croissance depuis 2010 (pdf)
国际航协:2017年全球航空货运需求增长9% (pdf)
الطلب على الشحن الجوي يرتفع بنسبة 9% خلال عام 2017 محققاً أقوى نمو منذ عام 2010 (pdf)
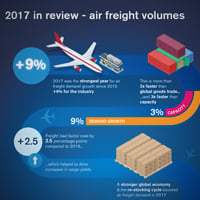
Geneva – The International Air Transport Association (IATA) released full-year 2017 data for global air freight markets showing that demand, measured in freight tonne kilometers (FTKs) grew by 9.0%. This was more than double the 3.6% annual growth recorded in 2016.
Freight capacity, measured in available freight tonne kilometers (AFTKs), rose by 3.0% in 2017. This was the slowest annual capacity growth seen since 2012. Demand growth outpaced capacity growth by a factor of three.
Air cargo's strong performance in 2017 was sealed by a solid result in December. Year-on-year demand growth in December increased 5.7%. This was less than half the annual growth rate seen during the middle of 2017 but still well above the five-year average of 4.7%. Freight capacity grew by 3.3% year-on-year in December.
Full-year 2017 demand for air freight grew at twice the pace of the expansion in world trade (4.3%). This outperformance was a result of strong global demand for manufacturing exports as companies moved to restock inventories quickly.
"Air cargo had its strongest performance since the rebound from the global financial crisis in 2010. Demand grew by 9.0%. That outpaced the industry-wide growth in both cargo capacity and in passenger demand. We saw improvements in load factors, yields and revenues. Air cargo is still a very tough and competitive business, but the developments in 2017 were the most positive that we have seen in a very long time," said Alexandre de Juniac, IATA's Director General and CEO.
"The outlook for air freight in 2018 is optimistic. Consumer confidence is buoyant. And we see growing strength in international e-commerce and the transport of time- and temperature-sensitive goods such as pharmaceuticals. Overall the pace of growth is expected to slow from the exceptional 9.0% of this year. But we still expect a very healthy 4.5% expansion of demand in 2018. Challenges remain, including the need for industry-wide evolution to more efficient processes. That will help improve customer satisfaction and capture market share as the expectations of shippers and consumers grow ever more demanding," said de Juniac.
Regional Performance
Airlines in all regions reported an increase in demand in 2017.
Asia-Pacific carriers saw demand in freight volumes grow 5.6% in December 2017 compared to the same period in 2016 and capacity grow by 2.2%. This contributed to a growth in freight demand of 7.8% in 2017 compared to 2016. Capacity increased 1.3%. The strong performance of Asia-Pacific carriers in 2017 largely reflects the ongoing demand for exports from the region's major exporters China and Japan which has been driven in part by a pick-up in economic activity in Europe and a continued solid performance from the US. This is expected to support demand into the New Year.
North American airlines saw freight demand increase by 5.4% in December 2017 year-on-year and capacity increase of 2.2%. This contributed to an annual growth in 2017 of 7.9%. Capacity grew by 1.6% in the 2017 calendar year. The strength of the US economy and the US dollar have improved the inbound freight market in recent years. Looking towards 2018, the recently agreed US tax reform bill may help to support freight volumes in the period ahead although this may be offset by the recent weakening in the dollar.
European airlines posted a 5.0% year-on-year increase in freight demand in December and a capacity rise of 3.2%. The strong performance in December boosted cargo volumes for the 2017 calendar year by 11.8% - the largest increase of all regions with the exception of Africa. Capacity in the region increased by 5.9% in the 2017 calendar year. This is consistent with Europe's manufacturers' export orders growing at their fastest pace on record. This is expected to support demand into the New Year.
Middle Eastern carriers' freight volumes increased 6.3% year-on-year in December and capacity increased 4.7%. This contributed to an annual increase in demand of 8.1% in 2017 – the third fastest growth rate of all the regions. Capacity increased 2.6%. However, having not seen the strong upward demand of other regions in the first half of 2017, Middle-Eastern carries' share of global demand dropped for the first time in 18 years.
Latin American airlines experienced a growth in demand of 4.9% in December and a capacity increase of 11.6%. This contributed to an annual growth in freight demand of 5.7% and a capacity increase of 3.1% in 2017. This was the first increase in annual demand in two years. The pick-up in demand comes alongside signs of economic recovery in the region's largest economy, Brazil. Seasonally-adjusted international freight volumes are now back to the levels seen at the end of 2014.
African carriers' posted the fastest growth in year-on-year freight volumes, up 15.6% in December 2017 and a capacity increase of 7.9%. This contributed to an annual growth in freight demand of 24.8% in 2017 – the fastest growth rate of all regions. This is only the second time African airlines have topped the global demand growth chart since 1990. Capacity in 2017 increased 9.9%. Demand has been boosted by very strong growth in Africa-Asia trade which increased by more than 64% in the first eleven months of 2017.
View the full infographic and read the 2017 freight analysis now.
For more information, please contact:
Corporate Communications
Tel: +41 22 770 2967
Email: corpcomms@iata.org
Notes for Editors:
- IATA (International Air Transport Association) represents some 280 airlines comprising 83% of global air traffic.
- You can follow us at http://twitter.com/iata2press for news specially catered for the media.
- Explanation of measurement terms:
- FTK: freight tonne kilometers measures actual freight traffic
- AFTK: available freight tonne kilometers measures available total freight capacity
- FLF: freight load factor is % of AFTKs used
- IATA statistics cover international and domestic scheduled air freight for IATA member and non-member airlines.
- Total freight traffic market shares by region of carriers in terms of FTK are: Asia-Pacific 37%, Europe 24.2%, North America 20.5%, Middle East 13.7%, Latin America 2.7%, Africa 1.9%.

