
Translations:
Le fret aérien maintient sa tendance à la baisse en février 2019 (pdf)
Continúa la tendencia bajista de la demanda de carga aérea en febrero de 2019 (pdf)
معدلات الطلب على الشحن الجوي تواصل هبوطها في شهر فبراير لعام 2019 (pdf)
Taxa de crescimento do transporte aéreo de carga continua baixa em fevereiro de 2019 (pdf)
国际航协:2月份全球航空货运需求持续下降 (pdf)
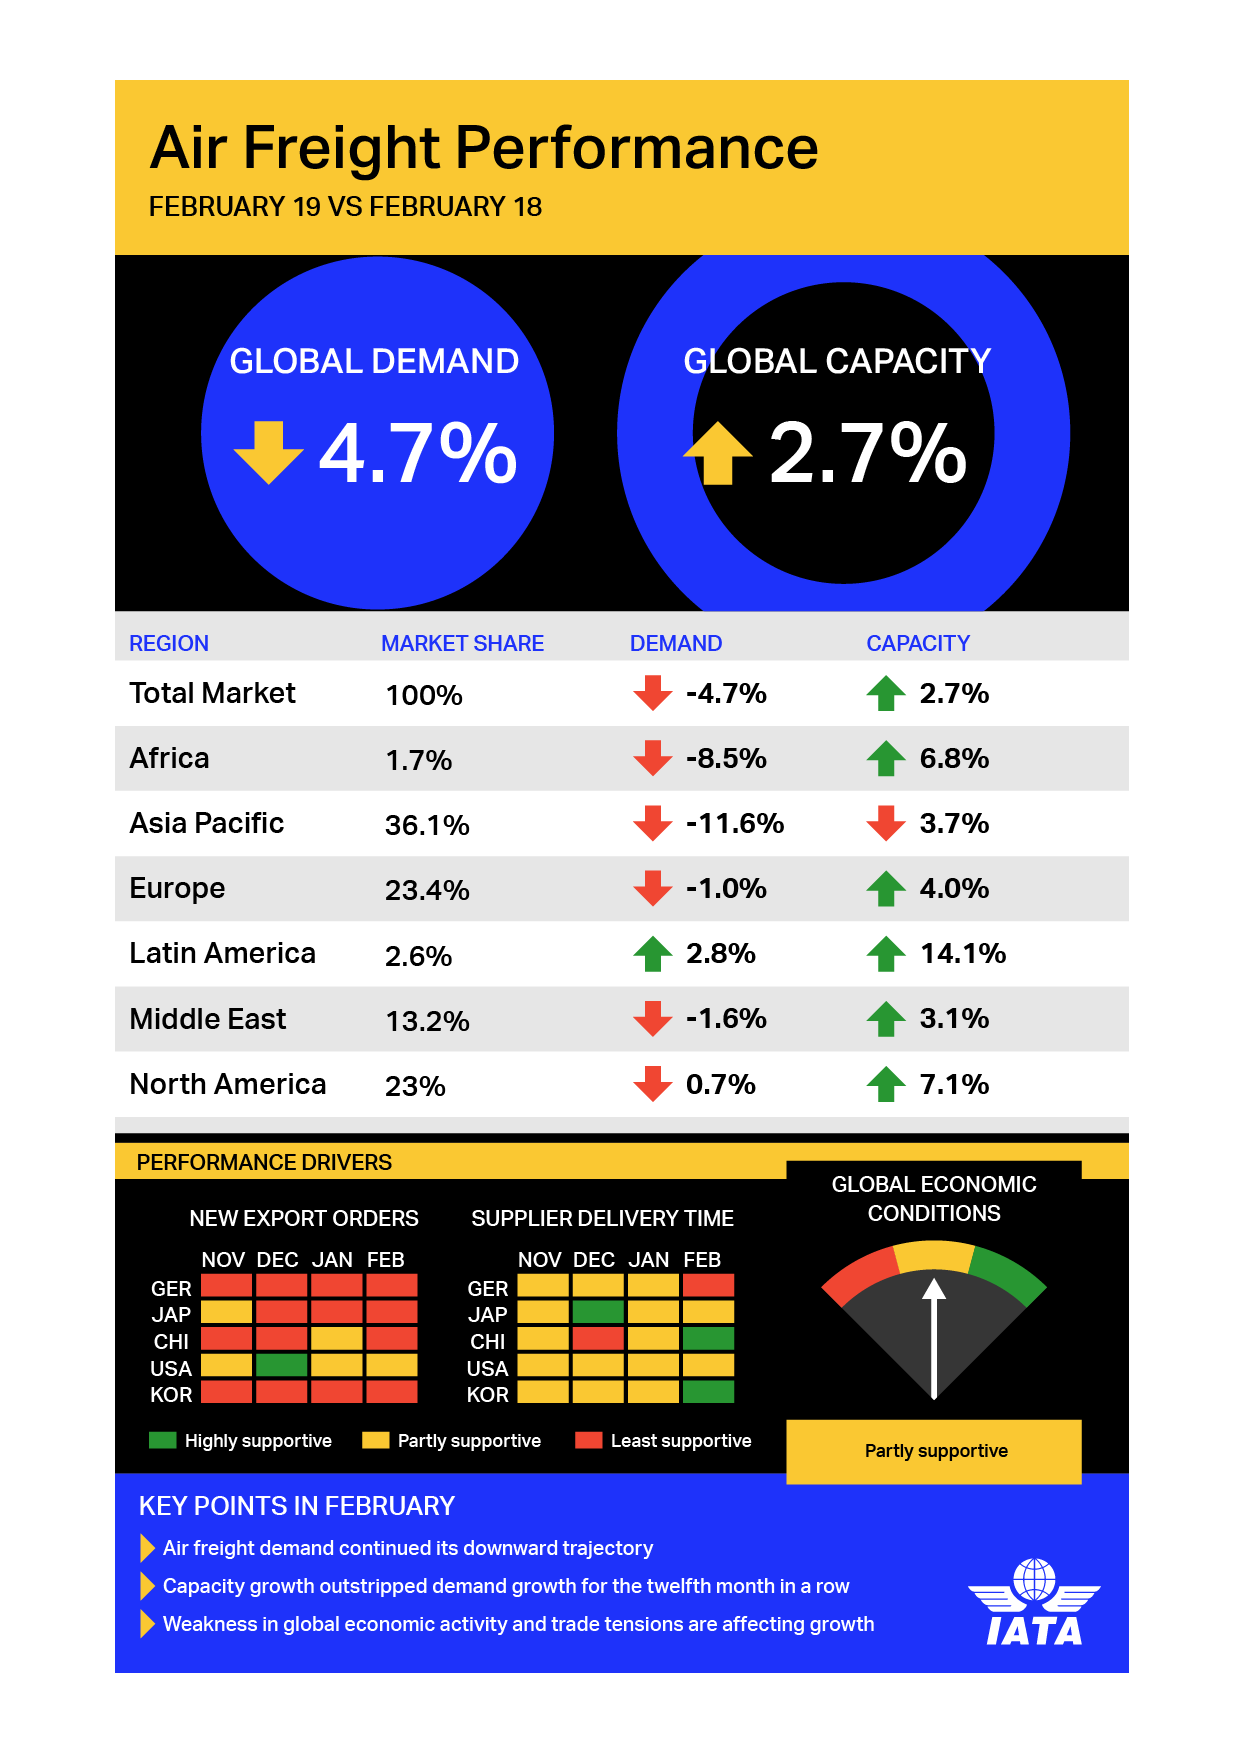
3 April 2019 (Geneva) - The International Air Transport Association (IATA) released data for global air freight markets showing that demand, measured in freight tonne kilometers (FTKs), decreased 4.7% in February 2019, compared to the same period in 2018. This was the fourth consecutive month of negative year-on-year growth and the worst performance in the last three years.
Freight capacity, measured in available freight tonne kilometers (AFTKs), rose by 2.7% year-on-year in February 2019. This was the twelfth month in a row that capacity growth outstripped demand growth.
Demand for air cargo continues to face significant headwinds:
- Trade tensions weigh on the industry;
- Global economic activity and consumer confidence have weakened;
- And the Purchasing Managers Index (PMI) for manufacturing and export orders has indicated falling global export orders since September 2018.
“Cargo is in the doldrums with smaller volumes being shipped over the last four months than a year ago. And with order books weakening, consumer confidence deteriorating and trade tensions hanging over the industry, it is difficult to see an early turnaround. The industry is adapting to new markets for e-commerce and special cargo shipments. But the bigger challenge is trade is slowing. Governments need to realize the damage being done by protectionist measures. Nobody wins a trade war. We all do better when borders are open to people and to trade,” said Alexandre de Juniac, IATA’s Director General and CEO.
| february 2019 (% year-on-year) | World share | FTK | Aftk | fLF (%-pt) | FLF (level) |
|---|---|---|---|---|---|
| Total Market | 100.0% | -4.7% | 2.7% | -3.5% | 44.7% |
| Africa | 1.7% | -8.5% | 6.8% | -6.1% | 36.3% |
| Asia Pacific | 35.5% | -11.6% | -3.7% | -4.2% | 47.3% |
| Europe | 23.3% | -1.0% | 4.0% | -2.6% | 53.0% |
| Latin America | 2.6% | 2.8% | 14.1% | -3.3% | 29.7% |
| Middle East | 13.3% | -1.6% | 3.1% | -2.2% | 46.6% |
| North America | 23.6% | -0.7% | 7.1% | -3.0% | 37.9% |
Regional Performance
All regions reported a contraction in year-on-year demand growth in February 2019 except for Latin America.
Asia-Pacific airlines saw demand for air freight contract by 11.6% in February 2019, compared to the same period in 2018. Weaker manufacturing conditions for exporters in the region, ongoing trade tensions and a slowing of the Chinese economy impacted the market. Capacity decreased by 3.7%.
North American airlines saw demand contract by 0.7% in February 2019, compared to the same period a year earlier. This was the first month of negative year-on-year growth recorded since mid-2016, reflecting the sharp fall in trade with China. North American carriers have benefited from the strength of the US economy and consumer spending over the past year. Capacity increased by 7.1%.
European airlines experienced a contraction in freight demand of 1.0% in February 2019 compared to a year ago. The decline is consistent with weaker manufacturing conditions for exporters in Germany, one of Europe’s major economies. Trade tensions and uncertainty over Brexit also contributed to a weakening in demand. Capacity increased by 4.0% year-on-year.
Middle Eastern airlines’ freight volumes contracted 1.6% in February 2019 compared to the year-ago period. Capacity increased by 3.1%. A clear downward trend in seasonally-adjusted international air cargo demand is now evident with weakening trade to/from North America contributing to the decrease.
Latin American airlines posted the fastest growth of any region in February 2019 versus last year with demand up 2.8%. Despite the economic uncertainty in the region, a number of key markets are performing strongly. Seasonally-adjusted international freight demand achieved growth for the first time in six months. Capacity increased by 14.1%.
African carriers saw freight demand decrease by 8.5% in February 2019, compared to the same month in 2018. Seasonally-adjusted international freight volumes are lower than their peak in mid-2017; despite this, they are still 25% higher than their most recent trough in late-2015. Capacity grew 6.8% year-on-year.
View the full infographic (pdf)
Read the full Freight Analysis for February (pdf)
For more information, please contact:
Corporate Communications
Tel: +41 22 770 2967
Email:
corpcomms@iata.org
Notes for Editors:
- IATA (International Air Transport Association) represents some 290 airlines comprising 82% of global air traffic.
- You can follow us at http://twitter.com/iata for news specially catered for the media.
- Explanation of measurement terms:
- FTK: freight tonne kilometers measures actual freight traffic
- AFTK: available freight tonne kilometers measures available total freight capacity
- FLF: freight load factor is % of AFTKs used
- IATA statistics cover international and domestic scheduled air freight for IATA member and non-member airlines.
- Total freight traffic market shares by region of carriers in terms of FTK are: Asia-Pacific 35.5%, Europe 23.3%, North America 23.6%, Middle East 13.3%, Latin America 2.6%, and Africa 1.7%.