Translations
La carga aérea arranca con moderación en 2023 (pdf)
Carga aérea começa 2023 com lentidão (pdf)
国际航协:2023年航空货运市场开年疲软 (pdf)
قطاع الشحن الجوي يسجل بداية متواضعة في عام 2023 (pdf)
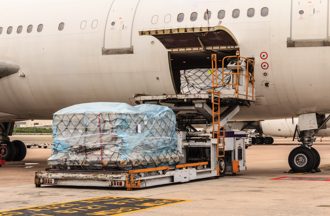
Geneva - The International Air Transport Association (IATA) released data for January 2023 global air cargo markets showing that air cargo demand declined as economic headwinds persist.
Global demand, measured in cargo tonne-kilometers (CTKs*), fell 14.9% compared to January 2022 (-16.2% for international operations).
Capacity (measured in available cargo tonne-kilometers, ACTK) was up 3.9% compared to January 2022. This was the first year-on-year growth in capacity since October 2022. International cargo capacity increased 1.4% compared to January 2022. The uptick in ACTKs reflects the strong recovery of belly capacity in passenger airline markets offsetting a decline international capacity offered by dedicated freighters.
Several factors in the operating environment should be noted:
- The global new export orders component of the manufacturing PMI, a leading indicator of cargo demand, increased in January for the first time since October 2022. For major economies, new export orders are growing, and in China and the US, PMI levels are close to the critical 50-mark indicating that demand for manufactured goods from the world’s two largest economies is stabilizing.
- Global goods trade decreased by 3.0% in December, this was the second monthly decline in a row.
- The Consumer Price Index for G7 countries decreased from 7.4% in November to 6.7% in January. Inflation in producer (input) prices reduced by 2.2 percentage points to 9.6% in December.
”With January cargo demand down 14.9% and capacity up 3.9%, 2023 began under some challenging business conditions. That was accompanied by persistent uncertainties, including war in Ukraine, inflation, and labor shortages. But there is solid ground for some cautious optimism about air cargo. Yields remain higher than pre-pandemic. And China’s much faster than expected shift from its zero COVID policy is stabilizing production conditions in air cargo’s largest source market. That will give a much-needed demand boost as companies increase their engagement with China,” said Willie Walsh, IATA’s Director General.
Air cargo market in detail - January 2023 (% year on year)
|
|
WORLD SHARE1 | CTK | ACTK | CLF(%-PT)2 | CLF(LEVEL)3 |
|---|---|---|---|---|---|
|
Total Market |
100.0% |
-14.9% |
-3.9% |
-9.9% |
44.8% |
|
Africa |
2.0% |
-9.5% |
-1.8% |
-3.8% |
43.9% |
|
Asia Pacific |
32.4% |
-19.0% |
8.8% |
-15.5% |
45.2% |
|
Europe |
21.8% |
-20.4% |
-9.3% |
-7.5% |
54.1% |
|
Latin America |
2.7% |
4.6% |
34.4% |
-9.3% |
32.5% |
|
Middle East |
13.0% |
-11.8% |
9.6% |
-10.0% |
41.1% |
|
North America |
28.1% |
-8.7% |
-2.3% |
-5.1% |
42.3% |
1) % of industry CTKs in 2022 2) Year-on-year change in load factor 3) Load Factor Level
January Regional Performance
Asia-Pacific airlines saw their air cargo volumes decrease by 19% in January 2023 compared to the same month in 2022. This was an improvement in performance compared to December (-21.2%). Airlines in the region continue to be impacted by lower levels of trade and manufacturing activity and disruptions in supply chains due to the residual effects of COVID restrictions that were imposed by China. Additionally, the positioning of the Lunar New Year would have impacted cargo volumes in January. Available capacity in the region increased by 8.8% compared to January 2022.
North American carriers posted an 8.7% decrease in cargo volumes in January 2023 compared to the same month in 2022. This was a slight decrease in performance compared to December (-8.5%). Capacity increased 2.3% compared to January 2022.
European carriers saw the weakest performance of all regions with a 20.4% decrease in cargo volumes in January 2023 compared to the same month in 2022. This was a decrease in performance compared to December (-19.4%). Airlines in the region continue to be most affected by the war in Ukraine. Capacity decreased 9.3% in January 2023 compared to January 2022.
Middle Eastern carriers experienced a 11.8% year-on-year decrease in cargo volumes in January 2023. This was an improvement to the previous month (-14.4%). Capacity increased 9.6% compared to January 2022.
Latin American carriers reported a 4.6% increase in cargo volumes in January 2023 compared to January 2022. This was the strongest performance of all regions, and a significant improvement in performance compared to December which saw no growth. Capacity in January was up 34.4% compared to the same month in 2022.
African airlines saw cargo volumes decrease by 9.5% in January 2023 compared to January 2022. This was an improvement in performance compared to the previous month (-10%). Capacity was 1.8% below January 2022 levels.
> View the Air Cargo Market Analysis - January 2023 (pdf)
For more information, please contact:
Corporate Communications
Tel: +41 22 770 2967
Email: corpcomms@iata.org
Notes for Editors:
- * Please note that as of January 2020 onwards, we have clarified the terminology of the Industry and Regional series from ‘Freight’ to ‘Cargo’, the corresponding metrics being FTK (changed to ‘CTK’), AFTK (changed to ‘ACTK’), and FLF (changed to ‘CLF’), in order to reflect that the series have been consisting of Cargo (Freight plus Mail) rather than Freight only. The data series themselves have not been changed.
- IATA (International Air Transport Association) represents some 300 airlines comprising 83% of global air traffic.
- You can follow us at twitter.com/iata for announcements, policy positions, and other useful industry information.
- Explanation of measurement terms:
- CTK: cargo tonne-kilometers measures actual cargo traffic
- ACTK: available cargo tonne-kilometers measures available total cargo capacity
- CLF: cargo load factor is % of ACTKs used
- IATA statistics cover international and domestic scheduled air cargo for IATA member and non-member airlines.
- Total cargo traffic market share by region of carriers in terms of CTK is: Asia-Pacific 32.4%, Europe 21.8%, North America 28.1%, Middle East 13.0%, Latin America 2.7%, and Africa 2.0%.