Translations:
Le fret aérien en hausse de 9,1 % en septembre, la capacité demeure restreinte (pdf)
El sector de carga aérea crece 9,1% en septiembre - continúan las limitaciones de capacidad (pdf)
国际航协:9月份航空货运增长9.1% 运力仍受限 (pdf)
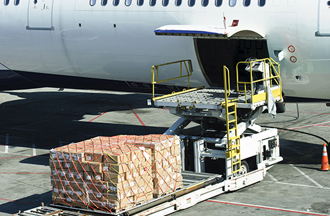
Geneva- The International Air Transport Association (IATA) released September 2021 data for global air cargo markets showing that demand continued to be well above pre-crisis levels and that capacity constraints persist.
As comparisons between 2021 and 2020 monthly results are distorted by the extraordinary impact of COVID-19, unless otherwise noted, all comparisons below are to September 2019 which followed a normal demand pattern.
- Global demand, measured in cargo tonne-kilometers (CTKs*), was up 9.1% compared to September 2019 (9.4% for international operations).
- Capacity remains constrained at 8.9% below pre-COVID-19 levels (September 2019) (-12% for international operations).
Several factors impacting global air cargo demand should be noted:
- Supply chain disruptions and the resulting delivery delays have led to long supplier delivery times. This typically means manufacturers use air transport, which is quicker, to recover time lost during the production process. The September global Supplier Delivery Time Purchasing Managers Index (PMI) was at 36, values below 50 are favorable for air cargo.
- The September new export orders component and manufacturing output component of the PMIs have deteriorated from levels in previous month but remain in favorable territory. Manufacturing activity continued to expand at a global level but, there was contraction in emerging economies.
- The inventory-to-sales ratio remains low ahead of the peak year-end retail events such as Single’s Day, Black Friday and Cyber Monday. This is positive for air cargo, however further capacity constraints put this at risk.
- The cost-competitiveness of air cargo relative to that of container shipping remains favorable. Pre-crisis, the average price to move air cargo was 12.5 times more expensive than sea shipping. In September 2021 it was only three times more expensive.
“Air cargo demand grew 9.1% in September compared to pre-COVID levels. There is a benefit from supply chain congestion as manufacturers turn to air transport for speed. But severe capacity constraints continue to limit the ability of air cargo to absorb extra demand. If not addressed, bottlenecks in the supply chain will slow the economic recovery from COVID-19. Governments must act to relieve pressure on global supply chains and improve their overall resilience,” said Willie Walsh, IATA’s Director General.
To relieve supply chain disruptions, including those highlighted by the US on supply chain resilience on the sidelines of last weekend’s G20 Summit, IATA is calling on governments to:
- Ensure that air crew operations are not hindered by COVID-19 restrictions designed for air travelers.
- Implement the commitments governments made at the ICAO High Level Conference on COVID-19 to restore international connectivity. This will ramp-up vital cargo capacity with “belly” space.
- Provide innovative policy incentives to address labor shortages where they exist.
Air cargo market detail - September 2021
| September 2021 % Vs AUGUST 2021 |
worldshare1 | ctk | actk | CLF(%-PT)2 | CLF(LEVEL)3 |
|---|---|---|---|---|---|
| Total Market | 100% | 9.1% | -8.9% | 9.1% | 55.3% |
| Africa | 2.0% | 32.8% | 4.6% | 9.1% | 42.8% |
| Asia Pacific | 32.6% | -0.2% | -21.0% | 14.1% | 68.0% |
| Europe | 22.3% | 5.9% | -12.4% | 10.4% | 60.4% |
| Latin America | 2.4% | -15.7% | -15.0% | -0.3% | 37.0% |
| Middle East | 13.0% | 17.6% | -4.1% | 10.3% | 55.8% |
| North America | 27.8% | 22.6% | 4.0% | 6.8% | 44.7% |
(1) % of industry CTKs in 2020 (2) Change in load factor vs same month in 2019 (3) Load factor level
Note:thetotal industry and regional growth rates are based on a constant sammple of airlines combining reported data and estimates for missing observations. Airline traffic is alloccated according to the region in which the carrier is registered;it should not be considered as regional traffic. Historical statistics are are subject to revision.
September Regional Performance
Asia-Pacific airlines saw their international air cargo volumes increase 4.5% in September 2021 compared to the same month in 2019.This was a slowdown in demand compared to the previous month’s 5.1% expansion. Demand is being affected by slowing manufacturing activity in China. International capacity is significantly constrained in the region, down 18.2% vs. September 2019. Looking forward, the decision by some countries in the region to lift travel restrictions should provide a boost for capacity.
North American carriers posted a 19.3% increase in international cargo volumes in September 2021 compared to September 2019. New export orders and demand for faster shipping times are underpinning the North American performance. International capacity was down 4.0% compared to September 2019, a slight improvement from the previous month.
European carriers saw a 5.3% increase in international cargo volumes in September 2021 compared to the same month in 2019. This was on a par with August’s performance (5.6%). Demand was strongest on the large North Atlantic trade lane (up 6.9% vs September 2019). Performance on other routes was weaker. Manufacturing activity, orders and long supplier delivery times remain favorable to air cargo demand. International capacity was down 13.5% on September 2019.
Middle Eastern carriers experienced a 17.6% rise in international cargo volumes in September 2021 versus September 2019, an improvement compared to the previous month (14.7%). International capacity was down 4% compared to September 2019.
Latin American carriers reported a decline of 17.1% in international cargo volumes in September compared to the 2019 period, which was the weakest performance of all regions. This was also slightly worse than the previous month (a 14.5% fall). Capacity in September was down 20.9% on pre-crisis levels, an improvement from August, which was down 24.2% on the same month in 2019.
African airlines saw international cargo volumes increase by 34.6% in September, the largest increase of all regions for the ninth consecutive month. Seasonally-adjusted volumes are now 20% above pre-crisis 2019 levels but have been trending sideways for the past six months. International capacity was 6.9% higher than pre-crisis levels, the only region in positive territory, albeit on small volumes.
- Read Air Freight September 2021 analysis (pdf).
- Access COVID-19 September 2021 traffic data presentation (pdf).
For more information, please contact:
Corporate Communications
Tel: +41 22 770 2967
Email: corpcomms@iata.org
Notes for Editors:
- * Please note that as of January 2020 onwards, we have clarified the terminology of the Industry and Regional series from ‘Freight’ to ‘Cargo’, the corresponding metrics being FTK (changed to ‘CTK’), AFTK (changed to ‘ACTK’), and FLF (changed to ‘CLF’), in order to reflect that the series have been consisting of Cargo (Freight plus Mail) rather than Freight only. The data series themselves have not been changed.
- IATA (International Air Transport Association) represents some 290 airlines comprising 83% of global air traffic.
- You can follow us at twitter.com/iata for announcements, policy positions, and other useful industry information.
- Explanation of measurement terms:
-CTK: cargo tonne-kilometers measures actual cargo traffic
-ACTK: available cargo tonne-kilometers measures available total cargo capacity
-CLF: cargo load factor is % of ACTKs used
-IATA statistics cover international and domestic scheduled air cargo for IATA member and non-member airlines.
-Total cargo traffic market share by region of carriers in terms of CTK is: Asia-Pacific 32.6%, Europe 22.3%, North America 27.8%, Middle East 13.0%, Latin America 2.4%, and Africa 2.0%.

