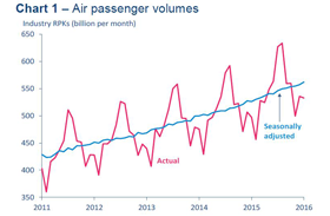
Geneva - The International Air Transport Association (IATA) announced global passenger traffic results for January 2016 showing demand (revenue passenger kilometers or RPKs) rose 7.1% compared to January 2015. This was ahead of the 2015 full year growth rate of 6.5%. January capacity rose 5.6%, with the result that load factor rose 1.1 percentage points to 78.8%, the highest load factor ever recorded for the first month of the year.
“January maintained the strong traffic growth trend seen in 2015, showing the resilience of demand for connectivity despite recent turmoil in equity markets. The record load factor is a result of strong demand for our product and airlines making the most productive use of their assets. Underlying conditions point to another strong year for passenger traffic, with the latest decline in oil prices likely providing additional stimulus for air travel growth,” said Tony Tyler, IATA’s Director General and CEO.
| January 2016 (% year-on-year) | World share1 | RPK | ASK | PLF (%-pt)2 | PLF (level)3 |
|---|---|---|---|---|---|
| Total Market | 100.0% | 7.1% | 5.6% | 1.1% | 78.8% |
| Africa | 2.2% | 11.0% | 7.1% | 2.5% | 71.3% |
| Asia Pacific | 31.5% | 10.4% | 7.9% | 1.8% | 78.5% |
| Europe | 26.7% | 4.0% | 2.1% | 1.4% | 77.9% |
| Latin America | 5.4% | 5.1% | 4.6% | 0.4% | 82.8% |
| Middle East | 9.4% | 10.5% | 12.8% | -1.6% | 77.9% |
| North America | 24.7% | 4.3% | 2.9% | 1.1% | 80.7% |
International Passenger Markets
- Asia Pacific carriers recorded an increase of 10.3% compared to January 2015. Capacity rose 7.6%, pushing up load factor 2.0 percentage points to 79.2%. A 7.3% increase in the number of direct airport connections within the Asia region over the past 12 months or so has helped to stimulate demand.
- European carriers’ international traffic climbed 4.2% in January compared to the year-ago period. Capacity rose 2.6% and load factor rose 1.2 percentage points to 78.8%. Airline strikes and the shutdown of Russia’s Transaero caused the region’s traffic to fall in the last quarter of 2015. Volumes have picked up somewhat in recent months.
- North American airlines saw demand rise 2.4% in January over a year ago. Capacity rose 1.3%, pushing up load factor 0.8 percentage points to 80.3%. North American international traffic growth was weakest among the regions, as carriers have focused on the stronger and larger domestic market.
- Middle East carriers had the strongest year-over-year demand growth in January at 10.9%, helped by ongoing network and fleet expansion. Capacity rose 12.9% and load factor dipped 1.4 percentage points to 77.8%.
- Latin American airlines’ traffic climbed 8.9% in January. Capacity rose 7.8% and load factor increased 0.8 percentage points to 82.5%, highest among the regions. Domestic traffic remains under pressure from economic difficulties in the region’s biggest economies, notably Brazil, but the strong growth in international demand shows little sign of slowing.
- African airlines saw January traffic jump 12.1% compared to January 2015. This continues the strong upward trend in travel since mid-2015 that coincides with a jump in exports from the region over the same period. With capacity up 8.2%, load factor rose 2.5 percentage point to 71.3%.
Domestic Passenger Markets
| January 2016 (% year-on-year) | World share1 | RPK | ASK | PLF (%-pt)2 | PLF (level)3 |
|---|---|---|---|---|---|
| Domestic | 36.4% | 6.8% | 5.1% | 1.3% | 78.9% |
| Australia | 1.1% | 3.8% | 2.3% | 1.1% | 76.9% |
| Brazil | 1.4% | -4.1% | -2.6% | -1.3% | 83.3% |
| China P.R. | 8.4% | 11.9% | 10.6% | 0.9% | 79.1% |
| India | 1.2% | 22.9% | 21.9% | 0.7% | 84.7% |
| Japan | 1.2% | 1.2% | -4.3% | 3.5% | 64.7% |
| Russian Federation | 1.3% | -2.0% | -5.2% | 2.2% | 68.4% |
| US | 15.4% | 5.5% | 3.7% | 1.4% | 81.0% |
- India’s domestic air travel soared 22.9% in January compared to a year ago. Growth is being propelled by the comparatively strong domestic economy and increases in air services. The Indian market overtook both Australia and Japan during 2015 and is currently level with Russia at around 1.2% of global RPKs.
- Russian domestic traffic slipped 2.0% in January. Despite the decline, the Russian domestic load factor reached an all-time January high as capacity fell at a faster rate, suggesting that local carriers have absorbed traffic affected by the shutdown of Transaero.
View January air passenger results (pdf)
Corporate Communications
Tel: +41 22 770 2967
Email: corpcomms@iata.org
Notes for Editors:
- IATA (International Air Transport Association) represents some 260 airlines comprising 83% of global air traffic.
- You can follow us at http://twitter.com/iata2press for news specially catered for the media.
- All figures are provisional and represent total reporting at time of publication plus estimates for missing data. Historic figures may be revised.
- Domestic RPKs accounted for about 36% of the total market in 2015. It is most important for North American airlines as it is about 66% of their operations. In Latin America, domestic travel accounts for 46% of operations, primarily owing to the large Brazilian market. For Asia-Pacific carriers, the large markets in India, China and Japan mean that domestic travel accounts for 45% of the region’s operations. It is less important for Europe and most of Africa where domestic travel represents just 11% and 14% of operations, respectively. And it is negligible for Middle Eastern carriers for whom domestic travel represents just 4% of operations.
- Explanation of measurement terms:
- RPK: Revenue Passenger Kilometers measures actual passenger traffic
- ASK: Available Seat Kilometers measures available passenger capacity
- PLF: Passenger Load Factor is % of ASKs used.
- IATA statistics cover international and domestic scheduled air traffic for IATA member and non-member airlines.
- Total passenger traffic market shares by region of carriers in terms of RPK for full year 2015 were: Asia-Pacific 31.5%, Europe 26.7%, North America 24.7%, Middle East 9.4%, Latin America 5.4%, and Africa 2.2%.