


Analyses and key forecasts for the industry, and perspectives on the world it operates in.


More on Sustainability
See all Sustainability Reports
Explore our library of sustainability publications.


Sustainability Publications


 Technologies")
Economics Publications


Charts of the Week
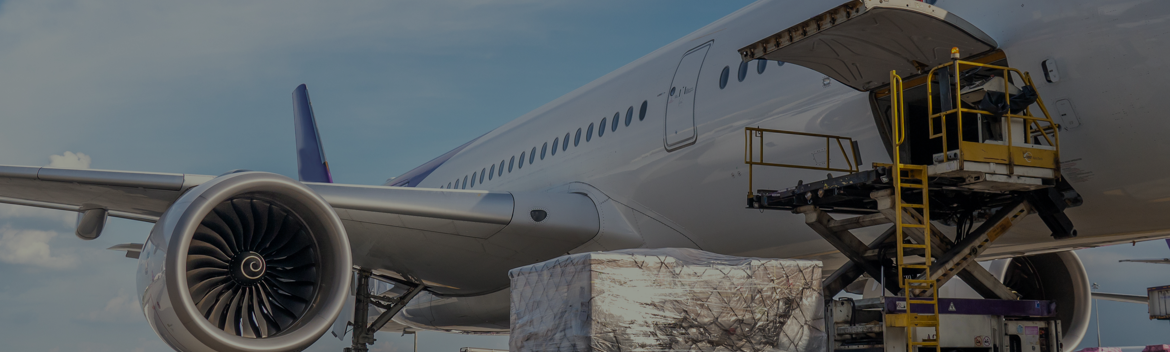
Powering DACCS: The Electricity the World Needs
11 July 2025
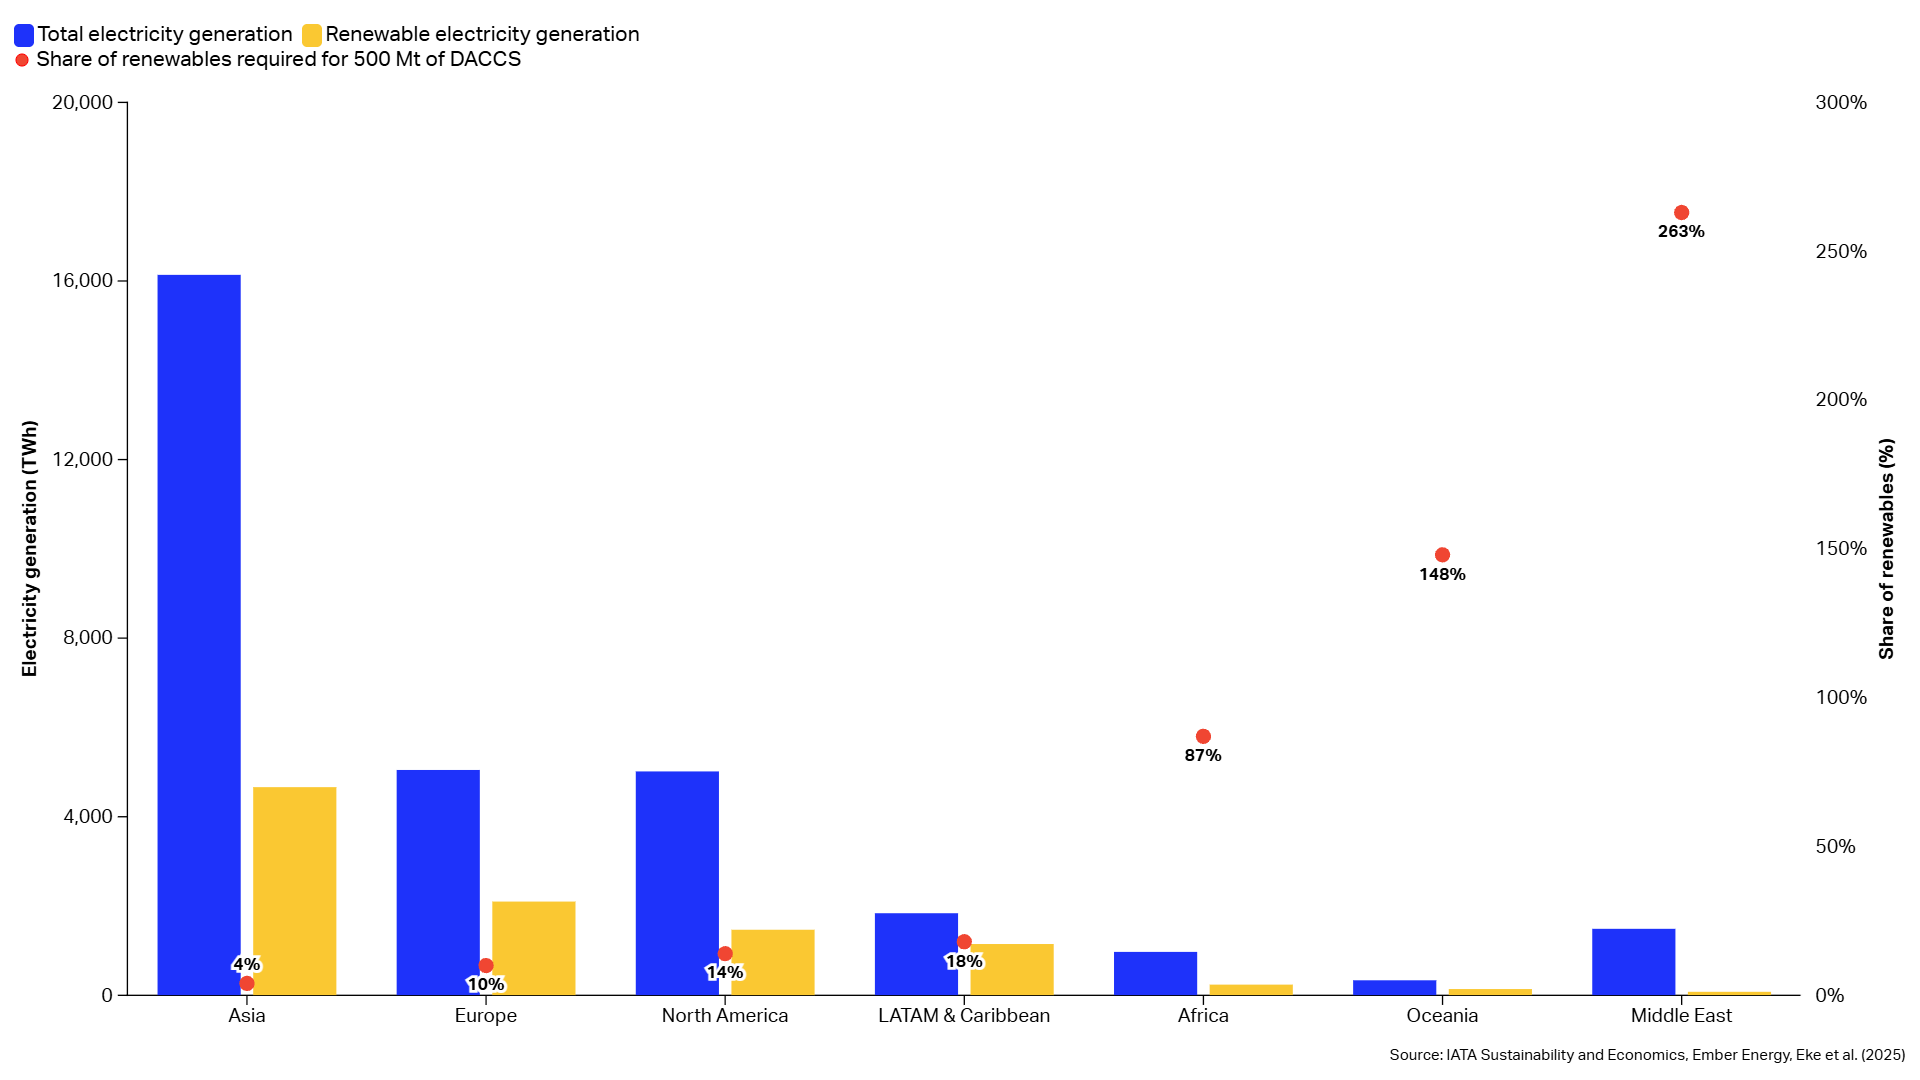
The air transport sector will require about 500 Mt of market-based measures (MBMs) and carbon dioxide
removals technologies (CDR), such as direct air carbon capture and storage (DACCS), to reach net-zero CO2 emissions in 2050.
India’s drive to leverage air transport for economic development
4 July 2025
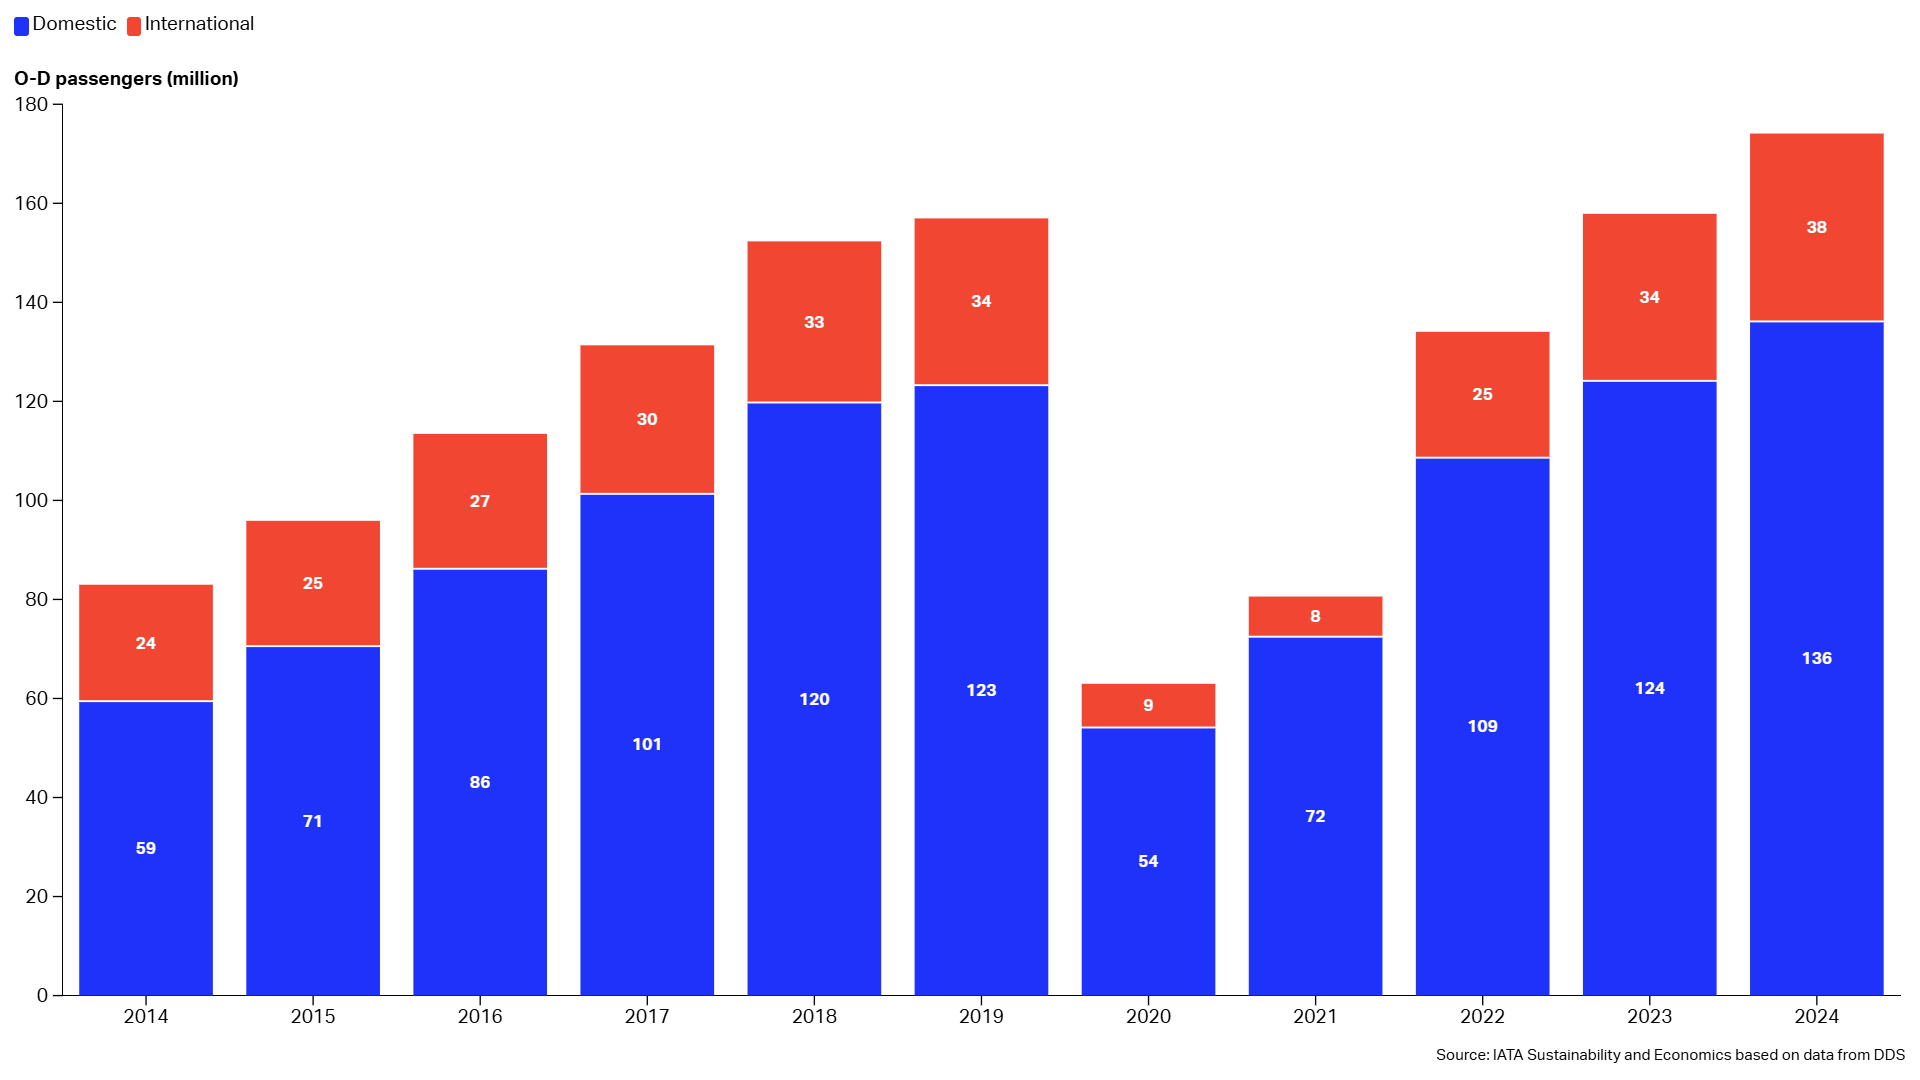
India is now the world’s 3rd largest air travel market, as measured by annual origin – destination (O-D) departures, which have more than doubled over the past decade.
War in the Middle East and Jet Fuel Supply
27 June 2025
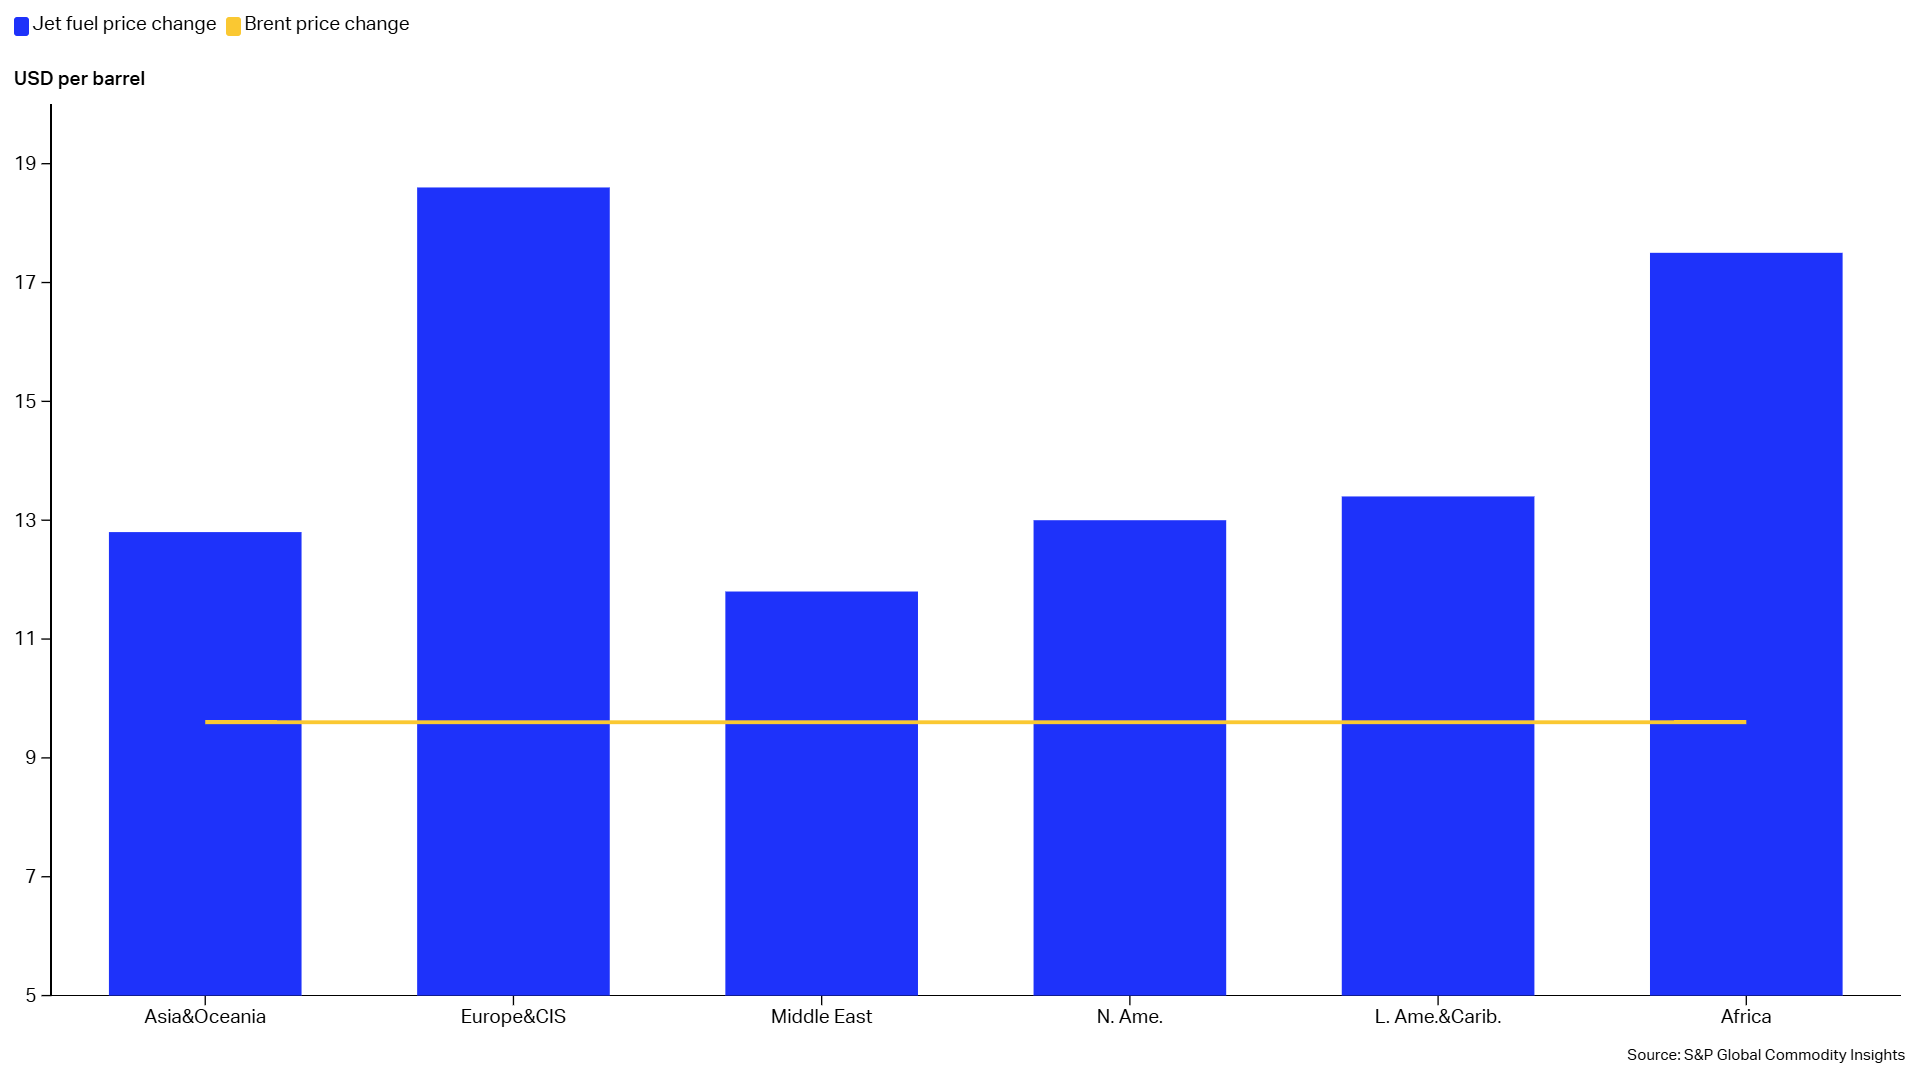
The Middle East is a critical region for trade and exports of crude oil and middle distillates such as diesel, gasoil, and jet fuel.
Briefs and Facts
Access to SAF in Europe Effects of ReFuelEU Aviation (RFEUA)
30 January 2025

The recent entry into force of ReFuelEU for Aviation (RFEUA) in January 2025 is already presenting significant challenges to aircraft operators in Europe.
An assessment of risks in 2025: Heightened policy uncertainty
5 December 2024

As 2025 is approaching fast, we assess the risks to the global economy that we are likely to face in the new year.
Airfare, Jet Fuel Price and Inflation - Facts
22 November 2024

Aviation Value Chain
15 February 2024
An analysis of investor returns in 2022 within the aviation value chain. This publication provides insight and interpretation from IATA into the 2022 economic performance of the aviation value chain.
Any questions?
Please contact us
More on IATA Economics
IATA Strategic Partnership Program - Airline Industry Economics
IATA Economics Terms & Conditions
Media
